
Analytics, Estonia, Foreign trade , Good for Business, Statistics
International Internet Magazine. Baltic States news & analytics
Saturday, 21.03.2026, 03:26
In 2018, Estonian foreign trade increased
 Print version
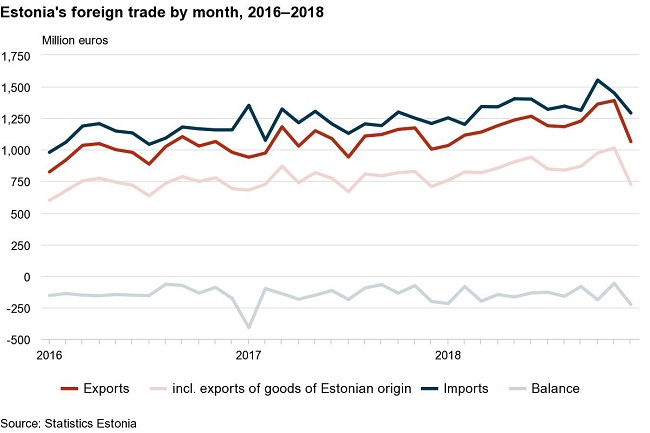
In 2018, the exports of goods from Estonia amounted to 14.4 bn euros and imports to Estonia to 16.2 bn euros at current prices. The trade deficit in 2018 was 1.8 bn euros, which is 69 mln euros less compared to 2017. The largest surplus was in the trade in wood and articles of wood and miscellaneous manufactured articles (incl. furniture, prefabricated wood buildings); the largest deficit was registered in the trade in transport equipment and in raw materials and products of the chemical industry.
In 2018, the share of European Union countries in Estonia’s total exports was 68% and in total imports 78%. The trade deficit with other EU countries totalled 2.8 bn euros, which is 55 mln euros less than in 2017. In trade with EU countries, exports increased by 6% and imports by 4%. Trade in goods with non-EU countries grew more – exports increased by 27% and imports by 37%. The trade surplus with non-EU countries was over 1 bn euros.
As in previous years, in 2018, electrical equipment was exported the most, accounting for 16% of Estonia’s total exports. Next came mineral products (15%) and wood and articles of wood (11%). The increase in exports was mostly affected by a rise in the exports of mineral products (up by 900 million euros), wood and articles of wood (up by 152 million euros) and mechanical appliances (up by 131 million euros). The biggest decrease in 2018 was recorded in the exports of agricultural products and food preparations.
The top destination countries of Estonia’s exports in 2018 were Finland (16% of Estonia’s total exports of goods), Sweden (11%) and Latvia (10%). Electrical equipment and base metals and articles of base metal were the main commodities exported to Finland; electrical equipment and wood and articles of wood were the main commodities exported to Sweden; mineral products, and agricultural products and food preparations were the main commodities exported to Latvia. The biggest increase occurred in exports to the USA, Singapore and Finland. The biggest decrease occurred in exports to Sweden, the Netherlands and Russia.
The share of goods of Estonian origin in total exports of goods was 72% in 2018. The exports of goods of Estonian origin increased by 12% and re-exports by 11% compared to 2017. In the exports of goods of Estonian origin, the greatest increase was in the exports of mineral products (incl. shale oil, solvent), wood and articles of wood (birch and pine pulpwood) and electrical equipment (data communication equipment). The main destination countries of goods of Estonian origin were Finland, Sweden and Germany. The biggest increase in the exports of goods of Estonian origin was in the exports to the USA and Singapore and the biggest decrease in the exports to Sweden.
The main commodities imported to Estonia were mineral products (15% of Estonia’s total imports of goods), electrical equipment (14%) and mechanical appliances, transport equipment, and agricultural products and food preparations (each 10%). The greatest increase was in the imports of mineral products (up by 1 bn euros), mechanical appliances (up by 208 mln euros) and base metals and articles of base metal (up by 168 mln euros).
The main countries of consignment in 2018 were Finland (13% of Estonia’s total imports of goods), Germany and Lithuania (10% each). From Finland, mineral products, and electrical equipment were imported the most. Transport equipment and mechanical appliances were imported the most from Germany, and mineral products and agricultural products and food preparations from Lithuania. The biggest y-o-y increase occurred in imports from Russia (up by 484 mln euros), Belarus (up by 342 mln euros) and Lithuania (up by 187 mln euros), with the largest increase in the imports of mineral products. At the same time, imports decreased the most from Poland and the Netherlands.
Estonia exported goods to 183 countries and imported goods from 143 countries. A positive foreign trade balance was recorded in the case of 139 countries. The biggest surplus was recorded in trade with the USA, followed by Norway and Singapore. The biggest deficit was recorded in trade with Germany, Lithuania and Poland.
| Month | Exports, million euros | Imports, million euros | Balance, million euros | |||||
|---|---|---|---|---|---|---|---|---|
| 2017 | 2018 | change, % | 2017 | 2018 | change, % | 2017 | 2018 | |
| TOTAL | 12,876 | 14,402 | 12 | 14,759 | 16,216 | 10 | -1,884 | -1,814 |
| 1st quarter | 3,096 | 3,290 | 6 | 3,750 | 3,796 | 1 | -654 | -506 |
| January | 941 | 1,033 | 10 | 1,352 | 1,253 | -7 | -412 | -220 |
| February | 974 | 1,116 | 15 | 1,075 | 1,201 | 12 | -101 | -85 |
| March | 1,182 | 1,141 | -3 | 1,323 | 1,342 | 1 | -141 | -201 |
| 2nd quarter | 3,268 | 3,694 | 13 | 3,725 | 4,147 | 11 | -457 | -453 |
| April | 1,029 | 1,192 | 16 | 1,214 | 1,341 | 10 | -186 | -149 |
| May | 1,151 | 1,236 | 7 | 1,305 | 1,405 | 8 | -154 | -168 |
| June | 1,089 | 1,266 | 16 | 1,206 | 1,402 | 16 | -117 | -136 |
| 3rd quarter | 3,172 | 3,601 | 14 | 3,526 | 3,979 | 13 | -354 | -378 |
| July | 942 | 1,190 | 26 | 1,130 | 1,321 | 17 | -188 | -130 |
| August | 1,109 | 1,183 | 7 | 1,205 | 1,346 | 12 | -96 | -163 |
| September | 1,121 | 1,228 | 10 | 1,191 | 1,313 | 10 | -70 | -85 |
| 4th quarter | 3,339 | 3,817 | 14 | 3,758 | 4,295 | 14 | -419 | -477 |
| October | 1,162 | 1,363 | 17 | 1,299 | 1,553 | 20 | -137 | -190 |
| November | 1,173 | 1,390 | 18 | 1,251 | 1,450 | 16 | -78 | -60 |
| December | 1,005 | 1,065 | 6 | 1,208 | 1,292 | 7 | -204 | -227 |
| Country of destination, group of countries | Exports, million euros | Share, % | Change on previous year, % | Country of consignment, group of countries | Imports, million euros | Share, % | Change on previous year, % |
|---|---|---|---|---|---|---|---|
| TOTAL | 14,402 | 100 | 12 | TOTAL | 16,216 | 100 | 10 |
| EU-28 | 9,780 | 68 | 6 | EU-28 | 12,617 | 78 | 4 |
| Euro area 19 | 6,806 | 47 | 8 | Euro area 19 | 9,074 | 56 | 4 |
| Non-EU | 4,622 | 32 | 27 | Non-EU | 3,599 | 22 | 37 |
| 1. Finland | 2,288 | 16 | 10 | 1. Finland | 2,088 | 13 | 1 |
| 2. Sweden | 1,574 | 11 | -9 | 2. Germany | 1,694 | 10 | 6 |
| 3. Latvia | 1,377 | 10 | 17 | 3. Lithuania | 1,567 | 10 | 14 |
| 4. USA | 929 | 6 | - | 4. Sweden | 1,420 | 9 | 11 |
| 5. Germany | 902 | 6 | -3 | 5. Russia | 1,414 | 9 | 52 |
| 6. Russia | 875 | 6 | -6 | 6. Latvia | 1,371 | 8 | 10 |
| 7. Lithuania | 789 | 5 | 4 | 7. Poland | 979 | 6 | -9 |
| 8. Norway | 547 | 4 | 7 | 8. Netherlands | 793 | 5 | -9 |
| 9. Denmark | 451 | 3 | 25 | 9. China | 594 | 4 | 0 |
| 10. Netherlands | 417 | 3 | -12 | 10. United Kingdom | 431 | 3 | 15 |
| Commodity section (chapter) by Combined Nomenclature (CN) | Exports | Imports | Balance, million euros | ||||
|---|---|---|---|---|---|---|---|
| million euros | share, % | change on previous year, % | million euros | share, % | change on previous year, % | ||
| TOTAL | 14,402 | 100 | 12 | 16,216 | 100 | 10 | -1,814 |
| Agricultural products and food preparations (I–IV) | 1,153 | 8 | -3 | 1,545 | 10 | 0 | -392 |
| Mineral products (V) | 2,164 | 15 | 71 | 2,473 | 15 | 71 | -309 |
| Raw materials and products of chemical industry (VI) | 740 | 5 | 8 | 1,368 | 8 | 7 | -628 |
| Articles of plastics and rubber (VII) | 430 | 3 | 3 | 843 | 5 | 5 | -413 |
| Wood and articles of wood (IX) | 1,531 | 11 | 11 | 564 | 4 | 16 | 967 |
| Paper and articles thereof (X) | 363 | 3 | 5 | 268 | 2 | -1 | 95 |
| Textiles and textile articles (XI) | 396 | 3 | -1 | 673 | 4 | 1 | -277 |
| Base metals and articles of base metal (XV) | 1,139 | 8 | 8 | 1,458 | 9 | 13 | -319 |
| Mechanical appliances (84) | 1,212 | 8 | 12 | 1,692 | 10 | 14 | -480 |
| Electrical equipment (85) | 2,279 | 16 | 3 | 2,228 | 14 | 1 | 50 |
| Transport equipment (XVII) | 900 | 6 | 0 | 1,672 | 10 | -13 | -772 |
| Optical, measuring, precision instruments (XVIII) | 416 | 3 | 6 | 380 | 2 | 11 | 36 |
| Miscellaneous manufactured articles (XX) | 1,205 | 8 | 7 | 397 | 3 | -2 | 808 |
| Other | 475 | 3 | 8 | 655 | 4 | 5 | -180 |


 «The Baltic Course» Is Sold and Stays in Business!
