
Analytics, Good for Business, Lithuania, Retail, Statistics
International Internet Magazine. Baltic States news & analytics
Tuesday, 17.03.2026, 13:34
Retail sales up 6.5% in Lithuania in 2018
 Print version
Statistics Lithuania informs that, based on provisional
data, in December 2018, the turnover (VAT excluded) of retail trade1 enterprises
amounted to EUR 1 bn 89 mln at current prices, and against
November 2018, seasonally and calendar adjusted, decreased by 0.2% at constant
prices (unadjusted – increased by 15.6%).
Over the month, the turnover of enterprises trading in food
products, seasonally and calendar adjusted, increased by 0.2, of those trading
in non-food products – 1, of those engaged in retail trade of automotive fuel –
decreased by 2.5% at constant prices.
Over the year (December 2018, against December 2017), the
turnover (VAT excluded) of retail trade enterprises, calendar adjusted,
increased by 4.7% at constant prices (unadjusted – 3.7%). The turnover of
enterprises trading in food products, calendar adjusted, increased by 2.7, of
those trading in non-food products – 6.7, of those engaged in retail trade of
automotive fuel – 4.8% at constant prices.
Fig. 1. Indices of turnover (VAT excluded) of retail trade enterprises
At constant prices, 2015 monthly average – 100
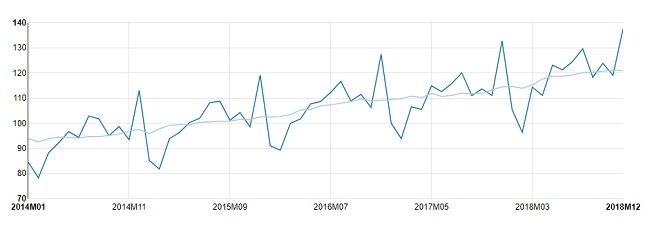
Fig. 2. Changes in turnover (VAT excluded) of retail trade enterprises, calendar adjusted
At constant prices, compared to the respective month of the previous year,%

In December 2018, the turnover of enterprises
engaged in food and beverage service activities (VAT excluded)
amounted to EUR 66.2 mln at current prices and, against November
2018, seasonally and calendar adjusted, decreased by 0.5% at constant prices
(unadjusted – 11.5%). Over a year, calendar adjusted, the turnover of such
enterprises increased by 4.7% at constant prices (unadjusted – 4.5%).
Fig. 3. Indices of turnover (VAT excluded) of food and beverage service enterprises
At constant prices, 2015 monthly average – 100
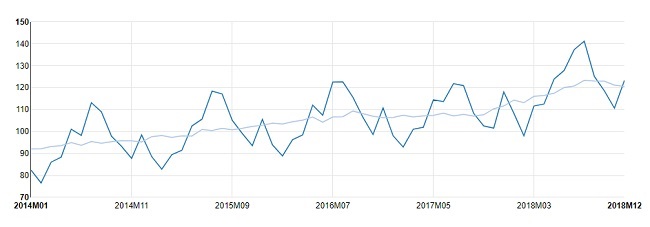
Fig. 4. Changes in turnover (VAT excluded) of food and beverage service enterprises, calendar adjusted
At constant prices, compared to the respective month of the previous year, %

At constant prices, %
Economic activities (NACE Rev. 2) | December 2018, against | January–December 2018, compared to January–December 2017, calendar adjusted | |
|---|---|---|---|
November 2018, seasonally and calendar adjusted | December 2017, calendar adjusted | ||
Division 47. Retail trade1 | –0.2 | 4.7 | 6.5 |
Retail trade, except for sale of automotive fuel | 0.5 | 4.7 | 5.2 |
Food, alcoholic beverages and tobacco | 0.2 | 2.7 | 3.4 |
In non-specialised stores | 0.1 | 2.5 | 3.4 |
In specialised stores | 2.6 | 3.8 | 1.5 |
Non-food products | 1.0 | 6.7 | 7.2 |
In specialised stores |
|
|
|
Textiles, clothing and footwear | 0.6 | 9.6 | 7.9 |
Audio and video equipment, recordings, metal articles, paints and glass, electrical household appliances, furniture and lighting equipment | 2.7 | 8.4 | 7.2 |
Information and communication equipment, cultural and recreation goods, watches, jewellery and other new goods | –5.5 | –10.0 | –3.0 |
Pharmaceuticals and medical goods and cosmetics | 1.9 | 9.7 | 4.6 |
Retail sale via mail order houses or via Internet | 1.7 | 15.4 | 22.6 |
In non-specialised stores | –1.3 | 25.2 | 36.7 |
Retail sale of automotive fuel | –2.5 | 4.8 | 11.2 |
Division 56. Food and beverage service activities | –0.5 | 4.7 | 11.1 |
________________________________


 «The Baltic Course» Is Sold and Stays in Business!
