
Analytics, Baltic States – CIS, EU – Baltic States, Good for Business, Lithuania, Tourism
International Internet Magazine. Baltic States news & analytics
Monday, 29.06.2026, 14:06
In 2017, the number of overnight trips of foreigners in Lithuania increased by 9.9%
 Print version
Foreign visitors' personal trips with one or more overnight stay made up 71.6%, business trips – 28.4%. In 2017, against 2016, the number of personal trips increased by 9, that of business trips – 12.2%. Men travelled to Lithuania more often – they made up 57.5% of all inbound tourists. Most tourists (41%) stated that the main sources of information about Lithuania were friends and relatives. Every second foreign visitor visited Lithuania for the first time.
More than half of foreigners (54%) arrived by road, while others arrived by air (41%), railway (3%), and sea (2%).
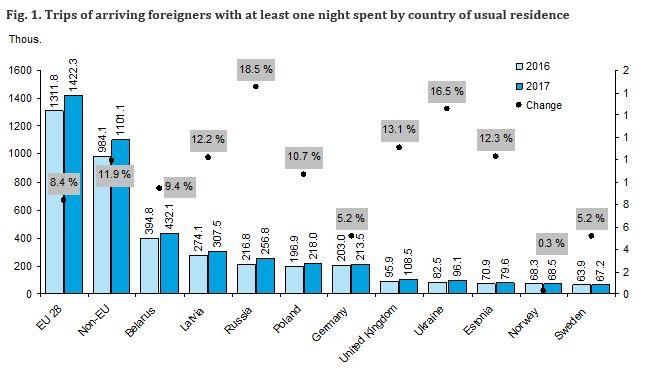
In 2017, most foreign overnight visitors arrived from Belarus (432.1 thousand, or 17.1%), Latvia (307.5 thousand, or 12.2%), Russia (256.8 thousand, or 10.2%), Poland (218 thousand, or 8.6%) and Germany (213.5 thousand, or 8.5%). The number of trips to Lithuania from the EU countries increased by 8.4%, from other countries – by 11.9%. In 2017, tourists from the EU countries accounted for 56.4% of all inbound tourists.
In 2017, the same as in 2016, the average duration of a foreigner’s stay in Lithuania was 4.3 nights. In 2017, compared to 2016, the number of shorter trips (1–3 overnight stays) increased by 16.9%; such trips accounted for 72.8% of all overnight trips, while trips with 4 and more overnight stays decreased by 5.2%. In 2017, the total number of nights spent totalled 10.8 million and, compared to 2016, increased by 8.6%.
In 2017, average expenditure per foreign overnight visitor in Lithuania amounted to about EUR 345.4, which is by 1.7% less than in 2016. The highest expenditure per tourist trip was recorded for tourists from the Ireland, Australia, Kazakhstan and Netherlands – about EUR 578 per trip with 6 overnight stays, the lowest – for tourists from Latvia and Estonia – EUR 218 per trip with 4 overnight stays. In 2017, the total expenditure of foreigners on trips with one or more overnight stays amounted to EUR 871.5 million, which is by 8.1% more than in 2016.
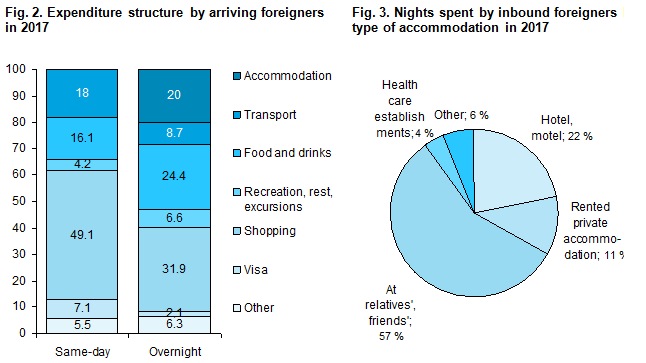
Half of arriving foreigners (56%) indicated that they had stayed in hotels and motels, 36% – at relatives’ and friends’. The most popular places visited by foreign tourists were Vilnius – 68%, Kaunas – 24%, Klaipėda – 17%, Trakai – 13%, and Palanga – 6%. Almost all (96%) foreign tourists gave a very good or good assessment to their trips to Lithuania.
Foreigners usually went to same-day trips for shopping (32%) or for business purposes (25%). In 2017, same-day visitors in Lithuania spent EUR 297.1 million, which is by 3% more than in 2016. Half (49%) of expenditure consisted of expenditure on shopping. Average expenditure per same-day trip of a foreigner totalled EUR 97.
In 2017, most same-day visitors arrived from Latvia (1 million, or 34.1%), Poland (566.6 thousand, or 18.5%), Belarus (536.0 thousand, or 17.5%), Russia (459.1 thousand, or 15%), and Estonia (205.7 thousand, or 6.7%).
Inbound tourism
|
|
Overnight trips |
Same-day trips |
||||
|
2016 |
2017 |
Growth/drop (-),% |
2016 |
2017 |
Growth/drop (-),% |
|
|
Number of tourists and visitors,
thousand |
|
|
|
|
|
|
|
Total |
1 245.5 |
1 384.7 |
11.2 |
964.0 |
879.2 |
–8.8 |
|
Males |
704.7 |
796.4 |
13.0 |
623.9 |
544.0 |
–12.8 |
|
Females |
540.8 |
588.3 |
8.8 |
340.1 |
335.2 |
–1.4 |
|
Number of trips, thousand |
|
|
|
|
|
|
|
Total |
2 295.9 |
2 523.3 |
9.9 |
3 025.9 |
3 067.0 |
1.4 |
|
Personal trips |
1 657.4 |
1 807.2 |
9.0 |
2 267.7 |
2 288.8 |
0.9 |
|
Business trips |
638.5 |
716.2 |
12.2 |
758.2 |
778.2 |
2.6 |
|
Trips by number of nights
spent, thousand |
|
|
|
|
|
|
|
Trips with 1–3 nights spent |
1 571.9 |
1 836.8 |
16.9 |
- |
- |
- |
|
Trips with 4 and more nights spent |
724.0 |
686.5 |
–5.2 |
- |
- |
- |
|
Number of nights spent,
thousand |
|
|
|
|
|
|
|
Total |
9 961.7 |
10
818.5 |
8.6 |
- |
- |
- |
|
Personal trips |
8 039.0 |
8 645.4 |
7.5 |
- |
- |
- |
|
Business trips |
1 922.7 |
2
173.1 |
13.0 |
- |
- |
- |
|
Expenditure, EUR million |
|
|
|
|
|
|
|
Total |
806.4 |
871.5 |
8.1 |
288.6 |
297.1 |
2.9 |
|
Personal trips |
629.4 |
680.0 |
8.0 |
230.2 |
235.7 |
2.4 |
|
Business trips |
177.0 |
191.5 |
8.2 |
58.4 |
61.4 |
5.1 |
Note. In the table, deviation due to rounding is possible.
For more information, see the Database of Indicators.


 «The Baltic Course» Is Sold and Stays in Business!
