
Analytics, Baltic States – CIS, EU – Baltic States, Good for Business, Latvia, Tourism
International Internet Magazine. Baltic States news & analytics
Friday, 26.04.2024, 13:51
Number of tourists hosted at Latvian hotels rose by 15.3% in Q1
 Print version
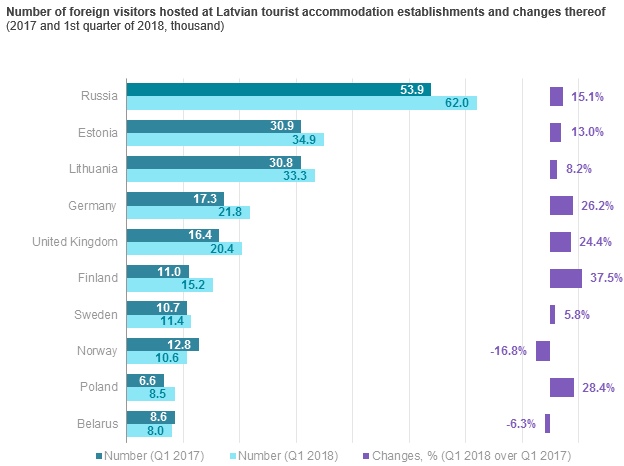
Over the 1st quarter of 2018, 304.6 thousand foreign visitors were hosted, which is 15.3% more than in the 1st quarter of the previous year, whereas the number of nights spent by them increased by 14.3%, reaching 605.8 thousand nights. The majority of foreign visitors came from Russia (62.0 thousand), Estonia (34.9 thousand), Lithuania (33.3 thousand), Germany (21.8 thousand), the United Kingdom (20.4 thousand), Finland (15.2 thousand).
In the 1st quarter of 2018, significant increase was observed in the number of visitors coming from Canada (3.6 times), Japan (66.2%), Denmark (47.2%), Finland (37.5%), Ukraine (33.3%) and Spain (31.1%). A drop was observed in the number of visitors coming from Norway (16.8%), USA (12.3%) and France (7.2%).
Out of the total number of foreign visitors, 45.4% or 138.2 thousand came from the neighbouring countries of Latvia – Russia (20.4%), Estonia (11.5%), Lithuania (10.9%) and Belarus (2.6%).
Out of all foreign visitors, majority (83.8%) stayed in Riga, 6.8% – in Jūrmala, 1.3% – in Daugavpils, 1.2% – in Liepāja, 1.1% – in Sigulda county.
In the 1st quarter of 2018, 149.6 thousand Latvian visitors were hosted at tourist accommodation establishments – 12.4% more than during the 1st quarter of the previous year, but the number of nights spent increased by 9.6% and comprised 279.4 million.
Latvian residents stayed mostly in Riga (33.3% of visitors), Jūrmala (14.7%), Liepāja (8.4%), Daugavpils (5.0%) and Sigulda county (3.1%).
Number of visitors hosted and nights spent at accommodation establishments
|
|
1st quarter
of 2018 |
1st quarter
of 2017 |
Changes,%
(1st quarter of 2018/2017) |
|||
|
|
Visitors
hosted |
Nights
spent |
Visitors
hosted |
Nights
spent |
Visitors
hosted |
Nights
spent |
|
TOTAL |
454 227 |
885 158 |
397 441 |
784 945 |
14.3 |
12.8 |
|
Latvian residents |
149 621 |
279 376 |
133 164 |
254 960 |
12.4 |
9.6 |
|
Foreign residents |
304 606 |
605 782 |
264 277 |
529 985 |
15.3 |
14.3 |
|
Russia |
62 028 |
119 019 |
53 868 |
102 543 |
15.1 |
16.1 |
|
Estonia |
34 881 |
52 158 |
30 855 |
45 413 |
13.0 |
14.9 |
|
Lithuania |
33 275 |
49 839 |
30 761 |
48 052 |
8.2 |
3.7 |
|
Germany |
21 782 |
44 375 |
17 260 |
35 089 |
26.2 |
26.5 |
|
United
Kingdom |
20 409 |
40 511 |
16 409 |
33 696 |
24.4 |
20.2 |
|
Finland |
15 164 |
28 373 |
11 030 |
20 777 |
37.5 |
36.6 |
|
Sweden |
11 363 |
26 011 |
10 743 |
24 691 |
5.8 |
5.3 |
|
Norway |
10 645 |
22 609 |
12 791 |
27 983 |
-16.8 |
-19.2 |
|
Poland |
8 528 |
14 039 |
6 643 |
11 265 |
28.4 |
24.6 |
|
Belarus |
8 012 |
25 095 |
8 553 |
24 539 |
-6.3 |
2.3 |
|
Ukraine |
7 301 |
14 102 |
5 479 |
12 905 |
33.3 |
9.3 |
|
Canada |
6 094 |
9 055 |
1 697 |
3 319 |
3.6 times |
2.7 times |
|
Italy |
5 855 |
12 001 |
5 376 |
10 088 |
8.9 |
19.0 |
|
Denmark |
5 679 |
11 171 |
3 859 |
6 877 |
47.2 |
62.4 |
|
USA |
4 984 |
11 099 |
5 681 |
11 766 |
-12.3 |
-5.7 |
|
Netherlands |
4 122 |
7 759 |
3 483 |
6 608 |
18.3 |
17.4 |
|
France |
4 101 |
7 710 |
4 420 |
8 307 |
-7.2 |
-7.2 |
|
Japan |
3 948 |
4 891 |
2 375 |
3 458 |
66.2 |
41.4 |
|
Spain |
3 284 |
6 875 |
2 505 |
5 401 |
31.1 |
27.3 |
|
Belgium |
2 558 |
4 766 |
2 541 |
4 601 |
0.7 |
3.6 |
|
Israel |
2 365 |
5 252 |
2 371 |
4 876 |
-0.3 |
7.7 |
|
Ireland |
2 135 |
4 343 |
1 805 |
3 599 |
18.3 |
20.7 |
|
Switzerland |
2 057 |
4 393 |
1 762 |
3 236 |
16.7 |
35.8 |
|
China |
1 994 |
4 309 |
1 639 |
3 865 |
21.7 |
11.5 |
Over the 1st quarter of 2018, 305.0 thousand visitors were hosted at tourist accommodation establishments in Riga – 15.8% more than during the 1st quarter of the previous year. The number of foreign visitors in Riga rose by 15.3%, amounting to 255.1 thousand. The largest number of foreign visitors hosted in Riga came from Russia (19.2%), Estonia (10.2%), Lithuania (8.9%), Germany (7.7%) and the United Kingdom (7.6%).
More tourism statistics is available in the CSB website section Tourism – Key Indicators. The data are published in the CSB database section Tourism (Short-term statistical data and Annual statistical data).


 «The Baltic Course» Is Sold and Stays in Business!
