
Analytics, Estonia, Foreign trade , Good for Business, Markets and Companies
International Internet Magazine. Baltic States news & analytics
Saturday, 10.05.2025, 08:00
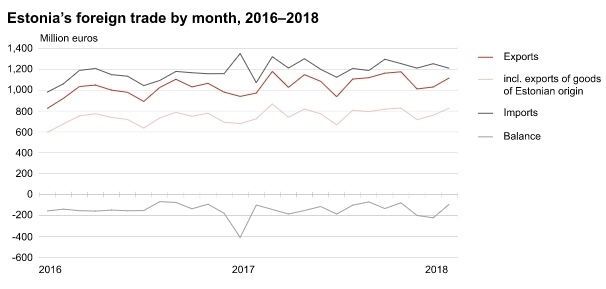
In February, the exports increased by 15% and imports by 13% in Estonia
 Print version
In February 2018, exports from Estonia amounted to 1.1 billion euros and
imports to Estonia to 1.2 billion euros. The trade deficit was 93 million
euros (in February 2017, it was 100 million euros).
In February, the
top destination countries of Estonia’s exports were Finland (16% of Estonia’s
total exports), Sweden (11%) and Latvia (8%). Electrical equipment and base
metals and articles of base metal were the main commodities exported to
Finland; electrical equipment and wood and articles of wood (wood in the rough,
doors and windows of coniferous wood) were the main commodities exported to
Sweden; and transport equipment (motor cars), agricultural products and food
preparations (spirits, beer, wheat) were the main commodities exported to
Latvia. The biggest increase occurred in exports to Singapore (up by 28
million euros), Germany (up by 23 million euros) and the United Kingdom (up by
21 million euros). In exports to Singapore and the United Kingdom, the exports
of mineral products increased. There was also an increase in the exports of
electrical equipment to Germany. The biggest decrease occurred in exports to
the Netherlands (down by 20 million euros), where less mineral products
were dispatched.
In February, the
biggest share in the exports of goods was held by mineral products (16% of the
total exports of goods), followed by electrical equipment (15%) and wood and
articles of wood (11%). The last time the exports of mineral products surpassed
the exports of electrical equipment was in 2011. The greatest increase was in
the exports of mineral products (up by 70 million euros), metals and articles
of base metal (up by 24 million euros) and mechanical appliances and electrical
equipment (both up by 12 million euros). At the same time, the exports of
miscellaneous manufactured articles decreased (down by 9 million euros).
The share of goods
of Estonian origin in total exports was 74% in February 2018. The exports of
goods of Estonian origin grew by 14% and re-exports by 18%. The exports of
goods of Estonian origin grew the most in the commodity sections of mineral
products (shale oil, fuel additives), metals and articles of base metal (metal
waste, metal structures) and agricultural products and food preparations
(barley, rape). The exports of miscellaneous manufactured articles decreased
(prefabricated wood buildings, lighting fixtures).
The main countries
of consignment in February were Finland (13% of Estonia’s total imports),
Germany (11%) and Sweden (10%). Electrical equipment and metals and articles of
base metal were the main commodities imported from Finland; transport equipment
and electrical equipment from Germany and Sweden. The biggest increase occurred
in imports from Belarus (up by 30 million euros, i.e. approximately 6
times), Finland (up by 25 million euros) and Latvia (up by 21 million euros).
Mineral products were imported more from Belarus (motor spirit, fuel
additives), electrical equipment from Finland and metals and articles of base
metal from Latvia.
The main
commodities imported to Estonia were electrical equipment (14% of the total
imports of goods), mineral products (13%) and mechanical appliances (12%). The
greatest increase was in the imports of mechanical appliances and mineral products
(both up by 32 million euros) and transport equipment (up by 21 million euros).
In February 2018, the foreign trade export volume index increased by 2% and the import volume index by 10% compared to February 2017.
|
Estonia’s foreign trade by month, 2017–2018 |
|||||||||||||||
|
Month |
Exports, million euros |
Imports, million euros |
Balance, million euros |
|
|||||||||||
|
2017 |
2018 |
change, % |
2017 |
2018 |
change, % |
2017 |
2018 |
|
|||||||
|
TOTAL |
1,911 |
2,147 |
12 |
2,422 |
2,462 |
2 |
-511 |
-316 |
|
||||||
|
January |
940 |
1,030 |
10 |
1,350 |
1,253 |
-7 |
-410 |
-223 |
|
||||||
|
February |
972 |
1,117 |
15 |
1,072 |
1,209 |
13 |
-100 |
-93 |
|
||||||
|
Main foreign trade partners of Estonia, February 2018 |
|
||||||||||||||
|
Country of
destination, group of countries |
Exports, million euros |
Share, % |
Change on
same month of previous year, % |
Country of
consignment, group of countries |
Imports, million euros |
Share, % |
Change on
same month of previous year, % |
|
|||||||
|
TOTAL |
1,117 |
100 |
15 |
TOTAL |
1,209 |
100 |
13 |
|
|||||||
|
EU-28 |
764 |
68 |
8 |
EU-28 |
937 |
77 |
8 |
|
|||||||
|
Euro area 19 |
506 |
45 |
7 |
Euro area 19 |
670 |
55 |
10 |
|
|||||||
|
Non-EU |
353 |
32 |
33 |
Non-EU |
272 |
23 |
34 |
|
|||||||
|
1. Finland |
174 |
16 |
13 |
1. Finland |
161 |
13 |
19 |
|
|||||||
|
2. Sweden |
128 |
11 |
-9 |
2. Germany |
130 |
11 |
16 |
|
|||||||
|
3. Latvia |
93 |
8 |
16 |
3. Sweden |
116 |
10 |
21 |
|
|||||||
|
4. Germany |
79 |
7 |
40 |
4. Latvia |
109 |
9 |
24 |
|
|||||||
|
5. Lithuania |
72 |
6 |
19 |
5. Russia |
106 |
9 |
21 |
|
|||||||
|
6. Russia |
56 |
5 |
3 |
6. Lithuania |
93 |
8 |
4 |
|
|||||||
|
7. United Kingdom |
44 |
4 |
87 |
7. Poland |
75 |
6 |
0 |
|
|||||||
|
8. Denmark |
41 |
4 |
20 |
8. Netherlands |
64 |
5 |
-9 |
|
|||||||
|
9. USA |
36 |
3 |
20 |
9. China |
41 |
3 |
-15 |
|
|||||||
|
10. Norway |
35 |
3 |
-11 |
10. Belarus |
36 |
3 |
- |
|
|||||||
|
|||||||||||||||
|
Exports and imports by commodity section, February 2018 |
||||||||
|
Commodity section (chapter) by Combined Nomenclature (CN) |
Exports |
Imports |
Balance, million euros |
|
||||
|
million euros |
share, % |
change on
same period of previous year, % |
million euros |
share, % |
change on
same period of previous year, % |
|
||
|
TOTAL |
1,117 |
100 |
15 |
1,209 |
100 |
13 |
-93 |
|
|
Agricultural
products and food preparations (I–IV) |
90 |
8 |
12 |
112 |
9 |
6 |
-22 |
|
|
Mineral products (V) |
180 |
16 |
64 |
160 |
13 |
25 |
20 |
|
|
Raw
materials and products of chemical industry (VI) |
55 |
5 |
4 |
104 |
9 |
5 |
-49 |
|
|
Articles
of plastics and rubber (VII) |
35 |
3 |
14 |
66 |
5 |
8 |
-31 |
|
|
Wood and
articles of wood (IX) |
121 |
11 |
7 |
44 |
4 |
16 |
77 |
|
|
Paper and
articles thereof (X) |
28 |
3 |
6 |
22 |
2 |
12 |
6 |
|
|
Textiles
and textile articles (XI) |
31 |
3 |
-4 |
51 |
4 |
-5 |
-20 |
|
|
Base
metals and articles of base metal (XV) |
93 |
8 |
36 |
111 |
9 |
21 |
-18 |
|
|
Mechanical appliances (84) |
93 |
8 |
14 |
139 |
12 |
30 |
-46 |
|
|
Electrical equipment (85) |
172 |
15 |
7 |
163 |
14 |
-1 |
10 |
|
|
Transport equipment (XVII) |
68 |
6 |
15 |
124 |
10 |
20 |
-56 |
|
|
Optical,
measuring, precision instruments (XVIII) |
30 |
3 |
-3 |
27 |
2 |
5 |
3 |
|
|
Miscellaneous manufactured articles (XX) |
87 |
8 |
-9 |
29 |
2 |
-1 |
58 |
|
|
Other |
34 |
3 |
11 |
57 |
5 |
26 |
-24 |
|
The statistics are based on the questionnaires “Intrastat” and “Exports
(sale of fish and crustaceans in foreign waters and ports)”, the due dates of
which were, respectively, 14 and 15 March 2018, and on the customs declaration
data of the Estonian Tax and Customs Board, which were sent to Statistics
Estonia on 20 March 2018. Statistics Estonia published the monthly summary of
foreign trade in 13 working days. In the case of the statistical activity
“Foreign trade”, the main representative of public interest is the Ministry of
Economic Affairs and Communications, commissioned by whom Statistics Estonia
collects and analyses the data necessary for conducting the statistical
activity.


 «The Baltic Course» Is Sold and Stays in Business!
