
Analytics, Good for Business, Industry, Latvia, Markets and Companies
International Internet Magazine. Baltic States news & analytics
Sunday, 21.06.2026, 10:11
In February, industrial output grew by 8.7% in Latvia
 Print version
Compared to the corresponding month of the previous year, the largest growth in manufacturing was recorded in the sectors of high and medium-high technology manufacturing: manufacture of chemicals and chemical products (of 40.3%), manufacture of electrical equipment (of 33.9%), manufacture of motor vehicles, trailers and semi-trailers (of 32.1%), as well as manufacture of basic pharmaceutical products and pharmaceutical preparations. An increase in output was also recorded in the sectors having the largest share in industrial production: manufacture of wood and of products of wood and cork, except furniture (of 5.7%), manufacture of food products (of 0.9%), manufacture of fabricated metal products, except machinery and equipment (of 16.8%) and in manufacture of non-metallic mineral products (of 8.2%).
Compared to January 2018, in February 2018 industrial production output, according to seasonally adjusted data at constant prices, went up by 3.9%, of which in manufacturing by 1.9%, in electricity and gas supply by 4.2%, whereas in mining and quarrying there was a drop of 2.5%.
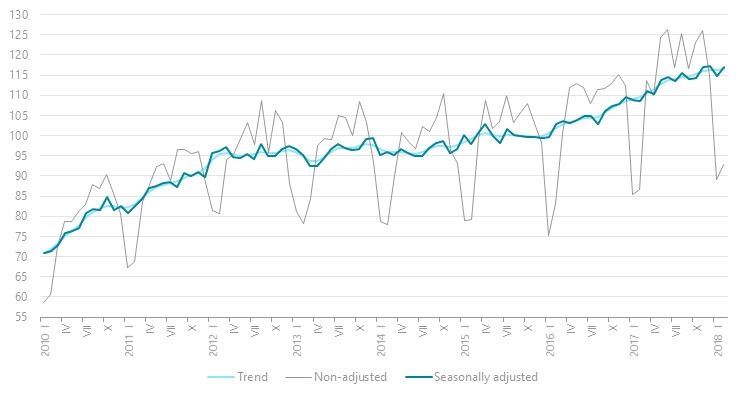
Volume index of manufacturing (2015=100)
Changes in industrial production output (as per cent, at constant prices)
|
|
January – February 2018, compared to January – February 2017 (calendar
adjusted) |
February 2018, compared
to |
|
|
January 2018
(seasonally adjusted) |
February 2017 (calendar
adjusted) |
||
|
Total
production |
6.5 |
3.9 |
8.7 |
|
Mining and
quarrying |
-0.8 |
-2.5 |
-2.1 |
|
Manufacturing |
5.8 |
1.9 |
7.3 |
|
Manufacture
of food products |
2.1 |
-1.9 |
0.9 |
|
Manufacture
of beverages |
-10.1 |
4.2 |
-9.0 |
|
Manufacture
of textiles |
-0.4 |
5.0 |
2.9 |
|
Manufacture
of wearing apparel |
-0.5 |
7.7 |
1.6 |
|
Manufacture of wood and of products of wood and cork, except furniture |
2.3 |
1.1 |
5.7 |
|
Manufacture of chemicals and chemical products |
33.4 |
9.0 |
40.3 |
|
Manufacture of other non-metallic mineral products |
11.3 |
-1.7 |
8.2 |
|
Manufacture of fabricated metal products, except machinery and equipment |
11.4 |
3.4 |
16.8 |
|
Manufacture of computer, electronic and optical products |
-0.4 |
-6.6 |
-11.4 |
|
Manufacture
of electrical equipment |
23.8 |
5.7 |
33.9 |
|
Manufacture of machinery and equipment |
4.2 |
9.4 |
13.5 |
|
Manufacture of motor vehicles, trailers and semi-trailers |
33.7 |
10.3 |
32.1 |
|
Manufacture
of furniture |
8.8 |
-2.9 |
7.3 |
|
Repair and installation of machinery and equipment* |
0.8 |
-5.7 |
-6.6 |
|
Electricity
and gas supply |
8.2 |
4.2 |
12.7 |
* Repair and maintenance of ships and boats, repair of fabricated metal products, machinery and equipment, installation of industrial machinery and equipment.
Manufacturing turnover2
Compared to February 2017, in February 2018 manufacturing turnover increased by 9.8% (according to calendar adjusted data at current prices). Turnover on the domestic market went up by 9.5% and in export by 9.9% (of which by 13.6% in euro area and by 7.1% in non-euro area).
Compared to January 2018, in February 2018 manufacturing turnover decreased by 0.3% (according to seasonally adjusted data). Turnover on the domestic market dropped by 0.8%, while it remained at the level of the previous month in export.
More information on seasonally adjusted, calendar adjusted and non-adjusted industrial production volume and turnover indices (including by sector) is available in the CSB database section Industry.
Methodological explanations
1The volume index of industrial production describes changes in the volume of industrial production during the reference period in comparison to the base period. The index is estimated by recalculating the production output indicator at constant prices with the help of producer price indices.
2The industrial turnover index measures the monthly development of market demand for industrial goods and services. It is calculated at current prices without excluding price influence. Unlike industrial goods that also include unfinished goods and goods in stock, turnover only includes the goods sold and industrial services provided.


 «The Baltic Course» Is Sold and Stays in Business!
