
Analytics, Employment, Good for Business, Labour-market, Latvia, Markets and Companies
International Internet Magazine. Baltic States news & analytics
Saturday, 21.03.2026, 10:45
In 2017, number of job vacancies rose by 2.6 thousand in Latvia
 Print version
In accordance with the CSB methodology, job vacancy is defined as a post for which no candidate chosen and no contract has been signed and employer is taking active steps to find a suitable employee, as well as which will be filled immediately or within the nearest time. CSB is calculating number of job vacancies and occupied posts based on statistical reports submitted and data of the State Revenue Service.
Out of the total number of jobs in Latvia (both occupied and vacant), 1.9% posts were vacant, 2.1% of which in public sector and 1.8% in private sector.
Compared to 2016, in 2017 the average number of occupied posts increased by 8.4 thou. or 0.9% (by 7.4 thou. or 1.2% in private sector and by 1.0 thou. or 0.4% in public sector).
Occupied posts and job vacancies by sector
|
|
Average in
2016, thou. |
Average in
2017, thou. |
Changes,% |
|
Job
vacancies, total |
14.4 |
17.0 |
17.9 |
|
Private
sector |
9.0 |
10.9 |
21.8 |
|
Public
sector |
5.5 |
6.1 |
11.6 |
|
Occupied
posts, total |
887.3 |
895.7 |
0.9 |
|
Private
sector |
599.3 |
606.7 |
1.2 |
|
Public
sector |
288.0 |
289.1 |
0.4 |
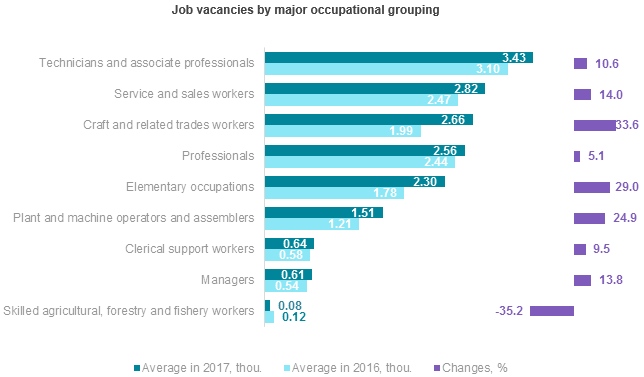
The highest share of job vacancies was recorded in the major occupational groups of craft and related trades workers (2.9% of all jobs in this group) and professionals (2.1%). Over the year, sharper increase was observed in demand for craft and related trades workers, elementary occupations, as well as plant and machine operators and assemblers.
In 2017, the highest share of job vacancies in the total number of jobs within the respective occupational grouping was recorded in public administration and defence, compulsory social security (4.6%), manufacturing and construction (2.3% in each), human health and social work activities (2.2%), as well as water supply; sewerage, waste management and remediation activities (2.1%).In transportation and storage, accommodation and food service activities, information and communication, as well as financial and insurance activities the share of job vacancies was comparatively high – 2.0%.
Job vacancies and occupied posts by main kind of economic activity
|
|
Average in
2016 |
Average in
2017 |
||||
|
Job
vacancies, thou. |
Occupied
posts, thou. |
Job
vacancy rate,% |
Job
vacancies, thou. |
Occupied
posts, thou. |
Job
vacancy rate,% |
|
|
Total |
14.4 |
887.3 |
1.6 |
17.0 |
895.7 |
1.9 |
|
Agriculture, forestry and fishing (A) |
0.3 |
21.4 |
1.3 |
0.3 |
21.7 |
1.3 |
|
Mining and
quarrying (B) |
0.0 |
2.8 |
0.7 |
0.0 |
2.8 |
0.9 |
|
Manufacturing
(C) |
2.1 |
111.7 |
1.9 |
2.6 |
112.2 |
2.3 |
|
Electricity, gas, steam and air conditioning supply (D) |
0.1 |
13.2 |
1.1 |
0.3 |
13.3 |
1.8 |
|
Water supply; sewerage, waste management and remediation activities (E) |
0.1 |
7.9 |
1.4 |
0.2 |
7.9 |
2.1 |
|
Construction
(F) |
0.9 |
54.2 |
1.7 |
1.3 |
58.1 |
2.3 |
|
Wholesale and retail trade, repair of motor vehicles and motorcycles |
1.9 |
146.8 |
1.3 |
2.2 |
145.2 |
1.5 |
|
Transportation
and storage (H) |
1.2 |
76.8 |
1.5 |
1.6 |
77.0 |
2.0 |
|
Accommodation and food service activities (I) |
0.7 |
32.5 |
2.2 |
0.7 |
32.9 |
2.0 |
|
Information
and communication (J) |
0.6 |
30.5 |
1.9 |
0.7 |
32.1 |
2.0 |
|
Financial and insurance activities (K) |
0.4 |
18.4 |
2.0 |
0.4 |
18.2 |
2.0 |
|
Real
estate activities (L) |
0.3 |
27.7 |
1.0 |
0.4 |
27.5 |
1.3 |
|
Professional, scientific and technical activities (M) |
0.3 |
41.1 |
0.6 |
0.3 |
41.4 |
0.8 |
|
Administrative and support service activities (N) |
0.6 |
37.3 |
1.6 |
0.7 |
38.0 |
1.7 |
|
Public administration and defence; compulsory social security (O) |
2.6 |
62.5 |
4.0 |
3.1 |
63.5 |
4.6 |
|
Education
(P) |
0.7 |
98.0 |
0.7 |
0.7 |
98.6 |
0.7 |
|
Human health and social work activities (Q) |
1.3 |
65.0 |
2.0 |
1.5 |
66.2 |
2.2 |
|
Arts, entertainment and recreation (R) |
0.2 |
24.8 |
0.6 |
0.2 |
24.9 |
0.9 |
|
Other
service activities (S) |
0.1 |
14.9 |
0.8 |
0.1 |
14.1 |
0.6 |
In 2017, the greatest share of job vacancies was observed in Riga region – 2.3% of all jobs within the region or 11.5 thou., whereas the lowest in Kurzeme region – 1.0% or 0.8 thou.
CSB is compiling information on occupied posts and job vacancies in breakdown by region based on the address of the office or main activity of an enterprise or institution.
At the end of the 4th quarter of 2017, in Latvia there were 17.6 thou. job vacancies, whereas job vacancy rate constituted 1.9%, which is slightly less than European Union average indicator (2.0%). In Lithuania 1.5% of all jobs were vacant, whereas in Estonia, just like in Latvia, those were 1.9%. Compared to the 4th quarter of 2016, the number of job vacancies went up by 3.1 thou. or 21.7%, whereas, compared to the 3rd quarter, it dropped slightly – by 0.1 thou. or 0.4%.
At the end of the 4th quarter of 2017, the number of occupied posts accounted for 897.7 thou., and, compared to the end of the 4th quarter of 2016, the number rose by 13.4thou. or 1.5%. Compared to the 3rd quarter, the number of posts dropped by 1.0 thou. or 0.1%.
Absolute changes and percentage changes are calculated from the data not converted into thousands.
More information on occupied posts and job vacancies in Latvia is available in the CSB website section Occupied Posts and Job Vacancies, Paid Working Hours – Key Indicators. Statistics on occupied posts and job vacancies in 2017 and 4th quarter of 2017 are published in the database section Occupied Posts and Job Vacancies, Paid Working Hours (Short term statistical data and Annual statistical data).
Methodological explanations
In accordance with the CSB methodology, job vacancy is defined as a post for which no candidate chosen and no contract has been signed and employer is taking active steps to find a suitable employee, as well as which will be filled immediately or within the nearest time. The job vacancy rate is calculated in per cent, by dividing the number of job vacancies by the total number of posts (occupied + vacant).
Data on occupied posts and job vacancies are acquired from the quarterly statistical reports on the activities of businesses, individual merchants, state and local government budgetary institutions, foundations, associations and funds, as well as from administrative data sources. Only those peasant and fisherman farms employing 50 and more employees are included.
Private sector includes commercial companies with central or local government capital participation of up to 50%, commercial companies of all types without central or local government capital participation, individual merchants, and agricultural holdings and fishermen farms employing with 50 and more persons.
Public sector includes central and local government institutions and commercial companies with central or local government capital participation 50% and more, public organisations and commercial companies thereof.


 «The Baltic Course» Is Sold and Stays in Business!
