
Analytics, Baltic States – CIS, EU – Baltic States, Good for Business, Latvia, Tourism
International Internet Magazine. Baltic States news & analytics
Friday, 26.04.2024, 22:14
The number of guests at Latvian hotels rose by 13.3% in Q2
 Print version
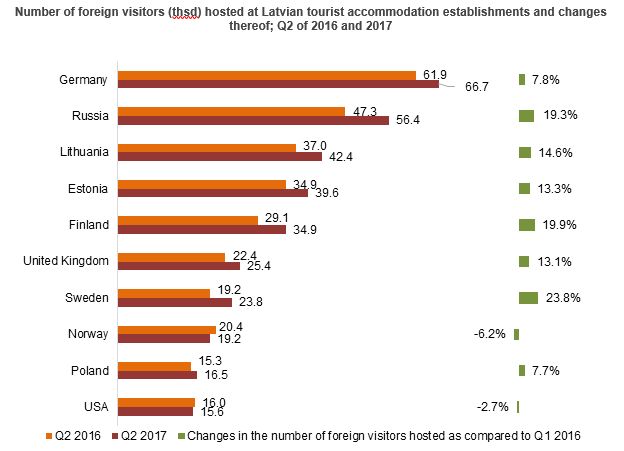
Over the 2nd
quarter of 2017, 495.3 thsd foreign visitors were hosted, which is 14.5%
more than during the respective period of the previous year, whereas the number
of nights spent by foreign visitors increased by 13.9%, reaching
929.0 thsd. Most of the foreign visitors came from Germany
(66.7 thsd), Russia (56.4 thsd), Lithuania (42.4 thsd), Estonia
(39.6 thsd), Finland (34.9 thsd) and the United Kingdom
(25.4 thsd). There has been a significant increase in the number of
visitors from Canada (3.8 times), Israel (two times), China (of 33.2%),
Denmark (of 24.9%) and Sweden (of 23.8%). The number of Russian
visitors hosted has grown by 19.3%. There were less foreign visitors from
Ukraine (by 7.8%), Norway (by 6.2%) and the United States
(by 2.7%).
29.8% of all
foreign visitors came from the neighbouring countries of Latvia – 11.4% were
from Russia, 8.6% from Lithuania, 8.0% from Estonia and 1.8% from Belarus.Out
of all foreign visitors, 79.5% stayed in Riga, 7.4% – in Jūrmala, 1.7% – in
Sigulda county, 1.5% – in Liepāja and 1.3% – in Daugavpils.
In the 2nd quarter of 2017,
198.9 thsd Latvian residents were hosted at tourist accommodation
establishments, which is 10.3% more than during the 2nd quarter of 2016,
whereas the number of nights spent increased by 15.2% and amounted to
389.3 thsd.
Latvian residents stayed
mostly in Riga (23.8% of visitors), Jūrmala (8.6%), Liepāja (8.4%), Daugavpils
(4.4%), Ventspils (3.7%) and Sigulda county (2.3%).
Number of visitors hosted at accommodation establishments and number of nights spent
|
|
Q2 2017 |
Q2 2016 |
Changes, % (Q2 2017/2016) |
|||
|
|
Number of visitors |
Number of nights |
Number of visitors |
Number of nights |
Number of visitors |
Number of nights |
|
TOTAL |
694 169 |
1 318 112 |
612 948 |
1 153 478 |
13.3 |
14.3 |
|
of whom: |
|
|
|
|
|
|
|
Latvian
residents |
198 871 |
389 259 |
180 289 |
337 765 |
10.3 |
15.2 |
|
Foreign
residents |
495 298 |
928 853 |
432 659 |
815 713 |
14.5 |
13.9 |
|
|
|
|
|
|
|
|
|
Germany |
66 718 |
125 503 |
61 887 |
111 661 |
7.8 |
12.4 |
|
Russia |
56 439 |
113 387 |
47 304 |
99 159 |
19.3 |
14.3 |
|
Lithuania |
42 363 |
67 270 |
36 975 |
59 044 |
14.6 |
13.9 |
|
Estonia |
39 559 |
55 580 |
34 908 |
52 037 |
13.3 |
6.8 |
|
Finland |
34 882 |
64 791 |
29 101 |
52 841 |
19.9 |
22.6 |
|
United
Kingdom |
25 383 |
48 954 |
22 441 |
45 459 |
13.1 |
7.7 |
|
Sweden |
23 785 |
45 173 |
19 217 |
30 933 |
23.8 |
46.0 |
|
Norway |
19 179 |
37 947 |
20 441 |
41 814 |
-6.2 |
-9.2 |
|
Poland |
16 462 |
24 853 |
15 283 |
23 132 |
7.7 |
7.4 |
|
USA |
15 560 |
30 992 |
15 984 |
30 303 |
-2.7 |
2.3 |
|
France |
13 789 |
24 747 |
11 510 |
21 546 |
19.8 |
14.9 |
|
Italy |
11 164 |
19 882 |
11 273 |
20 390 |
-1.0 |
-2.5 |
|
Spain |
9 078 |
15 598 |
9 087 |
14 612 |
-0.1 |
6.7 |
|
Belarus |
9 052 |
26 362 |
8 800 |
31 212 |
2.9 |
-15.5 |
|
Netherlands |
9 007 |
17 974 |
7 655 |
15 024 |
17.7 |
19.6 |
|
Japan |
8 561 |
11 040 |
8 007 |
10 989 |
6.9 |
0.5 |
|
Denmark |
7 919 |
14 582 |
6 339 |
11 728 |
24.9 |
24.3 |
|
Ukraine |
7 834 |
14 802 |
8 494 |
17 998 |
-7.8 |
-17.8 |
|
Canada |
6 925 |
9 695 |
1 456 |
3 036 |
375.6 |
219.3 |
|
China |
6 846 |
10 788 |
5 141 |
7 983 |
33.2 |
35.1 |
|
Israel |
5 837 |
15 309 |
2 918 |
6 844 |
100.0 |
123.7 |
|
Switzerland |
5 713 |
10 873 |
5 286 |
10 183 |
8.1 |
6.8 |
|
Austria |
4 800 |
8 496 |
4 659 |
7 863 |
3.0 |
8.1 |
|
Belgium |
4 698 |
9 134 |
4 503 |
9 086 |
4.3 |
0.5 |
In the 2nd
quarter of 2017, 441.2 thsd visitors were hosted at tourist accommodation
establishments of Riga – 12.2% more than during the 2nd quarter of the previous
year. The number of foreign visitors in Riga increased by 12.7% and amounted to
393.9 thsd. The majority of foreign visitors who came to Riga were from
Germany (13.3%), Russia (10.1%), Finland (7.2%), Estonia (6.7%), Lithuania (6.2%),
the United Kingdom (5.8%) and Sweden (5.3%).
More information
on tourism statistics is available in the Tourism – Key Indicators section of
the CSB website. The data are published in the “Tourism” section of the CSB
database (short-term statistical data and annual statistical data).


 «The Baltic Course» Is Sold and Stays in Business!
