
Analytics, Good for Business, Lithuania, Markets and Companies, Retail
International Internet Magazine. Baltic States news & analytics
Saturday, 27.04.2024, 02:43
In October, turnover of retail trade in Lithuania grew by 2.9%
 Print version
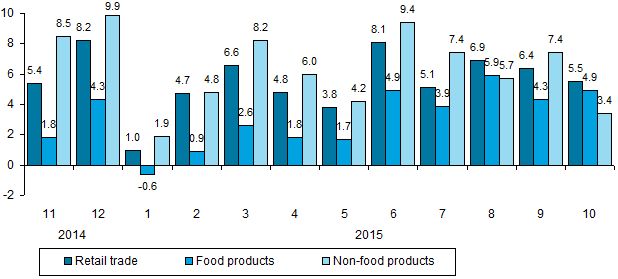
Over a month, the turnover of enterprises trading in food products increased by 5%, of those engaged in trading in non-food products – 0.7%, of those engaged in retail trade in automotive fuels – 3% at constant prices.
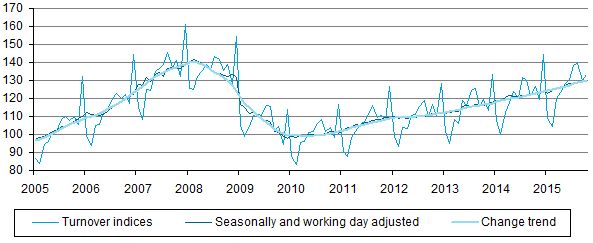 |
| Fig. 1. Indices of turnover (VAT excluded) of retail trade enterprises, at constant prices, 2010 monthly average – 100 |
* Retail trade, except of motor vehicles and motorcycles
In October 2015, against October 2014, the turnover (VAT excluded) of retail trade enterprises increased by 5.5% at constant prices (working day adjusted – 6.6%). The turnover of enterprises trading in food products increased by 4.9, of those engaged in retail trade in non-food products – 3.4, of those engaged in retail trade in automotive fuels – 10.8% at constant prices.
 |
| Fig. 2. Changes in turnover (VAT excluded) of retail trade enterprises, %, at constant prices, compared to the respective month of the previous year |
In October 2015, the turnover (VAT excluded) of food and beverage service enterprises amounted to EUR 42.5 million and, against September 2015, decreased by 6.6% at constant prices (seasonally and working day adjusted – increased by 0.2%). Compared to October 2014, the turnover of enterprises engaged in the said activities increased by 5.3% at constant prices (working day adjusted – by 5.2%).
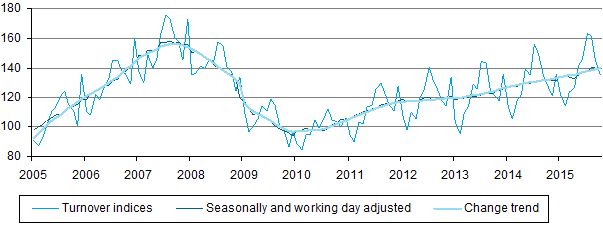 |
| Fig. 3. Indices of turnover (VAT excluded) of food and beverage service enterprises, at constant prices, 2010 monthly average – 100 |
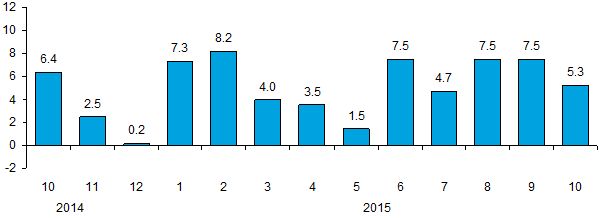 |
| Fig. 4. Changes in turnover (VAT excluded) of food and beverage service enterprises, %, at constant prices, compared to the respective month of the previous year |
Changes in turnover (VAT excluded), at constant prices, growth, drop (–), %
|
Economic activities (NACE Rev. 2) |
October 2015, against |
January–October 2015, against January–October 2014 |
October 2015, against 2010 monthly average |
|
|
September 2015 |
October 2014 |
|||
|
Division 47. Retail trade* |
2.9 |
5.5 |
5.4 |
33.5 |
|
Retail trade, except for sale of automotive fuel |
2.8 |
4.1 |
4.4 |
30.7 |
|
Retail sale of food, alcoholic beverages and tobacco |
5.0 |
4.9 |
3.1 |
13.2 |
|
Retail sale in non-specialised stores with food, beverages or tobacco predominating |
5.0 |
4.7 |
2.9 |
12.7 |
|
Retail sale of food, beverages and tobacco in specialised stores |
3.3 |
14.9 |
16.0 |
41.0 |
|
Retail sale of non-food products |
0.7 |
3.4 |
5.9 |
54.9 |
|
Retail sale of textiles, clothing and footwear in specialised stores |
8.1 |
4.2 |
3.1 |
78.0 |
|
Retail sale of audio and video equipment, recordings, metal articles, paints and glass, electrical household appliances, furniture and lighting equipment in specialised stores |
–0.3 |
–3.6 |
2.6 |
72.0 |
|
Retail sale of information and communication equipment, cultural and recreation goods, watches, jewellery and other new goods in specialised stores |
–7.1 |
13.7 |
15.1 |
31.3 |
|
Retail sale of pharmaceuticals and medical goods and cosmetics in specialised stores |
4.3 |
3.2 |
2.5 |
30.7 |
|
Retail sale of second-hand goods in stores |
–1.8 |
14.6 |
10.7 |
11.5 |
|
Other retail sale in non-specialised stores |
6.7 |
0.1 |
–5.2 |
–13.9 |
|
Retail sale of automotive fuel |
3.0 |
10.8 |
9.1 |
45.4 |
|
Division 56. Food and beverage service activities |
–6.6 |
5.3 |
5.7 |
35.2 |
* Retail trade, except of motor vehicles and motorcycles
For more information, see the Database of Indicators.


 «The Baltic Course» Is Sold and Stays in Business!
