
Analytics, Good for Business, Latvia, Markets and Companies, Retail
International Internet Magazine. Baltic States news & analytics
Saturday, 27.04.2024, 04:53
In June, retail trade turnover in Latvia increased by 0.8%
 Print version
Compared to May, the total retail trade turnover at current prices, not taking into account seasonality, in June grew by 2.9%. A year ago – in June 2014, compared to May, turnover grew by 0.3%.
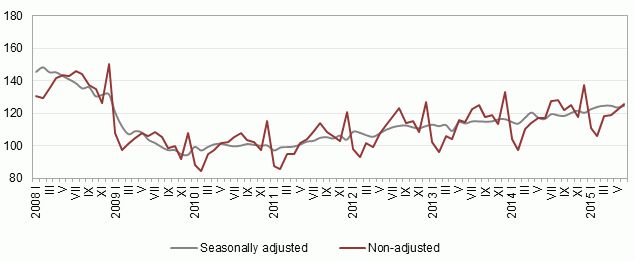 |
| Retail trade turnover indices (as % over average monthly turnover of 2010, at constant prices) |
Data source: Central Statistical Bureau of Latvia
Compared to June 2014, the total retail trade turnover in June 2015 increased by 6.8%, according to calendar adjusted data at constant prices. Rise in food commodity group comprised 3.7%. In non-food commodity group there was an increase of 9.0%, of which in retail sale of automotive fuel – of 14.1%.
Total retail trade turnover at current prices rose by 4.7% (not taking into account the calendar influence).
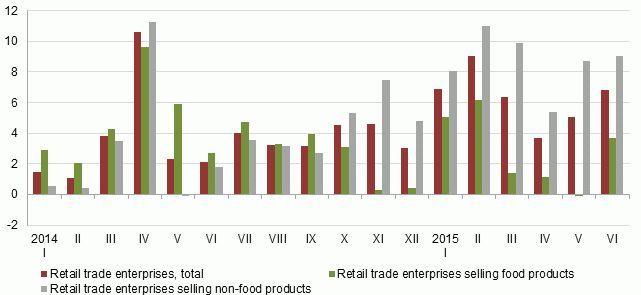 |
| Changes in turnover of retail trade enterprises (as % of corresponding month of the previous year, at constant prices, according to calendar adjusted data) |
In the 1st half-year, as compared to the same period of the previous year, total retail trade turnover has grown by 6.2%, according to calendar adjusted data. Retail trade in food products grew by 2.8%, retail trade of non-food products – by 8.6%.
Turnover indices of retail trade enterprises by main kind of economic activity (at constant prices)
|
|
January-June 2015 as % of January-June 2014 (calendar adjusted) |
June 2015 (%) over |
|||
|
May 2015 (seasonally adjusted) |
June 2014 (calendar adjusted) |
||||
|
Retail trade – total |
106.2 |
100.8 |
106.8 |
||
|
|
retail sale of food products, total |
102.8 |
101.6 |
103.7 |
|
|
|
retail sale of non-food products, total |
108.6 |
100.3 |
109.0 |
|
|
|
|
retail sale in non-specialised stores selling mainly non-food products |
94.7 |
95.0 |
96.1 |
|
|
|
retail sale of pharmaceutical and medical goods |
106.3 |
101.8 |
104.8 |
|
|
|
retail sale of textiles, clothing, footwear and leather goods |
102.7 |
102.5 |
105.6 |
|
|
|
retail sale of hardware, paints and glass |
103.4 |
96.7 |
101.4 |
|
|
|
retail sale of furniture, lighting equipment and other household articles in specialised stores |
106.9 |
97.4 |
102.2 |
|
|
|
retail sale of automotive fuel |
114.1 |
100.8 |
114.1 |
More information on seasonally adjusted, calendar adjusted and non-adjusted retail trade turnover indices is available in the CSB database in section "Trade and services".


 «The Baltic Course» Is Sold and Stays in Business!
