Analytics, Energy, Energy Market
International Internet Magazine. Baltic States news & analytics
Thursday, 01.01.2026, 02:44
British Petroleum:The Energy Outlook 2019
 Print version
The Energy Outlook 2019 edition
The Energy Outlook explores the forces shaping the global
energy transition out to 2040 and the key uncertainties surrounding that
transition. It shows how rising prosperity drives an increase in global energy
demand and how that demand will be met over the coming decades through a
diverse range of supplies including oil, gas, coal and renewables.
Global economic growth is driven by increasing
prosperity in developing economies, led by China and India.
The world economy continues to grow, driven by increasing prosperity in the developing world.
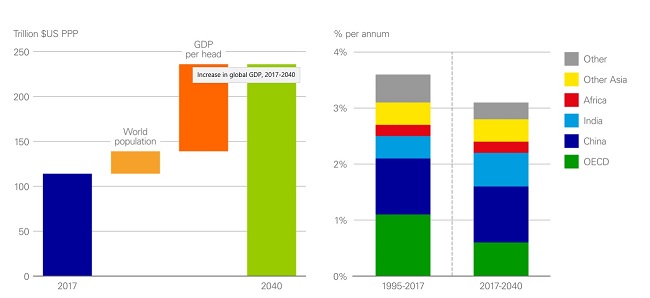
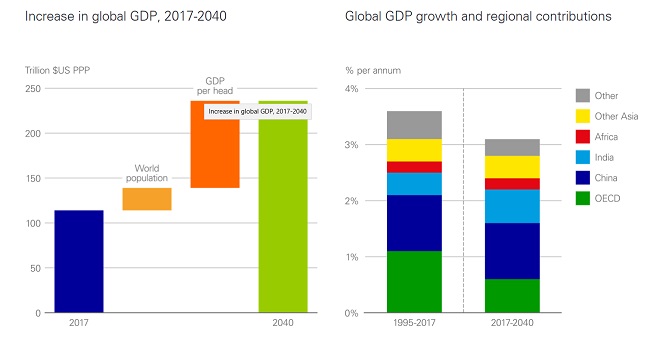
In the ET scenario, global GDP grows around 3¼% p.a. (on a
Purchasing Power Parity basis) – a little weaker than average growth over the
past 20 years or so.
Global output is partly supported by population growth, with
the world population increasing by around 1.7 billion to reach nearly 9.2
billion people in 2040.
But the vast majority of world growth is driven by
increasing productivity (i.e. GDP per head), which accounts for almost 80% of
the global expansion and lifts more than 2½ billion people from low incomes.
The emergence of a large and growing middle class in the developing world is an
increasingly important force shaping global economic and energy trends.
Developing economies account for over 80% of the expansion
in world output, with China and India accounting for around half of that
growth.
Africa continues to be weighed down by weak productivity,
accounting for almost half of the increase in global population, but less than
10% of world GDP growth.
Higher living standards drive increases in energy demand,
partly offset by substantial gains in energy intensity.
Expansion in global output and prosperity drives growth in
global energy demand.
Energy consumption in the ET scenario increases by around a
third over the Outlook. As with GDP growth, the vast majority of this increase
stems from increasing prosperity, as billions of people move from low to middle
incomes, allowing them to increase substantially their energy consumption per
head.
The overall growth in energy demand is materially offset by
declines in energy intensity (energy used per unit of GDP) as the world
increasingly learns to produce more with less: global GDP more than doubles
over the Outlook, but energy consumption increases by only a third.
Global energy grows at an average rate of 1.2% p.a. in the
ET scenario, down from over 2% p.a. in the previous 20 years or so. This weaker
growth reflects both slower population growth and faster improvements in energy
intensity.
Despite significant growth in prosperity and energy
consumption over the next 20 years, a substantial proportion of the world’s
population in the ET scenario still consumes relatively low levels of energy in
2040. The need for the world to produce ‘more energy’ as well as ‘less carbon’
is discussed below.
Alternative scenario – more energy
The world needs ‘more energy’ to allow global living
standards to continue to improve.
There is a strong link between human progress and energy
consumption.
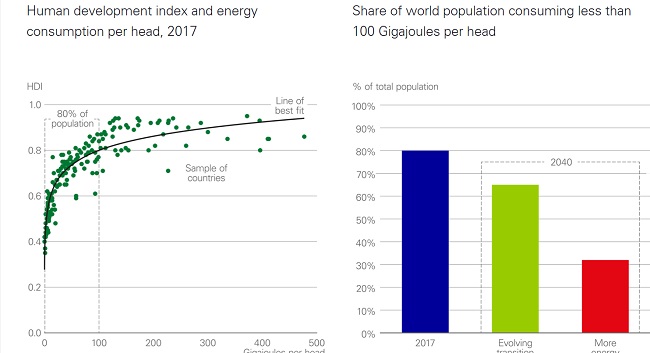
The United Nation’s Human Development Index (HDI) suggests
that increases in energy consumption up to around 100 Gigajoules (GJ) per head
are associated with substantial increases in human development and well-being,
after which the relationship flattens out.
Around 80% of the world’s population today live in countries
where average energy consumption is less than 100 GJ per head. In the ET
scenario, this proportion is still around two-thirds even by 2040. In the
alternative ‘More energy’ scenario this share is reduced to one-third by 2040.
This requires around 25% more energy by 2040 – roughly equivalent to China’s
energy consumption in 2017.
This assumes that countries in which energy consumption is
much greater than 100 GJ/per head do not economize on their energy use. If all
those countries reduced average consumption levels to the EU average in 2040
(around 120 GJ/per head), this would provide almost the entire energy required.
Improving energy efficiency in countries which use
disproportionate amounts of energy is likely to be key to solving the dual
challenge of providing ‘more energy and less carbon’.
The global energy system faces a dual challenge: the need
for ‘more energy and less carbon’.
The global energy system faces a dual challenge: the need
for ‘more energy and less carbon’.
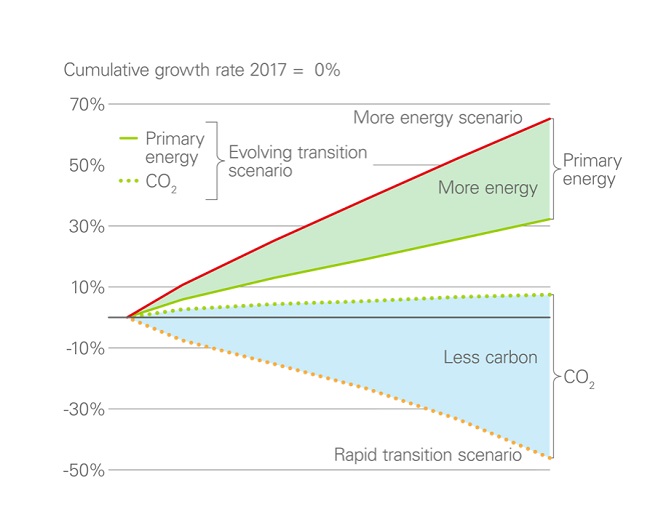
The ET scenario is not consistent with achieving either of
these challenges:
- energy
demand increases by a third, but two-thirds of the world population in
2040 live in countries in which average energy consumption is still less
than 100 GJ per head;
- CO2
emissions from energy use continue to edge up, increasing by almost 10% by
2040, rather than falling substantially.
The ‘More energy’ scenario represents a half-way step to
reducing the proportion of the world’s population living in countries where the
average level of consumption is below 100 GJ/per head to one-third by 2040.
The ‘Rapid transition’ scenario
represents a similar half-way step on carbon emissions: reducing CO2
emissions by around 45% by 2040, almost half-way to reducing entirely carbon
emissions from energy use.
Regional insight – EU
The European Union, thanks to its policies, leads the global
transition towards a carbon-free economy.
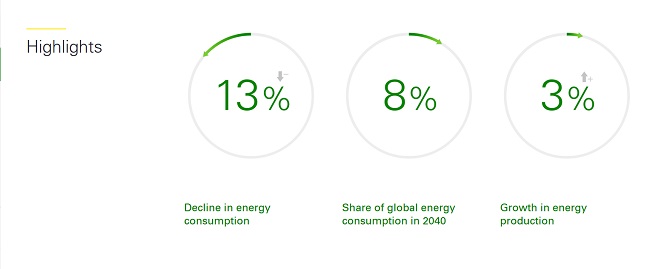
Renewables is the largest source of energy in 2040,
accounting for 29% of EU energy consumption.
Primary energy use in power generation grows by 10% over the
Outlook but falls in all end-use sectors.
Carbon emissions in 2040 decrease by 36% compared to the
2017 levels.
Projections
- Primary
energy use in power generation grows by 10% in 2040, reflecting a strong
process of electrification.
- Final
energy consumption declines across the board: non-combusted uses (-26%),
industry (-18%), buildings (-11%), and transportation (-18%).
- As a
result of those trends, power generation amounts to 52% of total primary
energy consumption in 2040, up from 42% in 2017.
- Accelerated
electrification boosts renewables in power (+169%) and, to a lesser
extent, hydro (+6%). Electrification sustains natural gas consumption,
which declines marginally (-2%) over the Outlook.
- Renewables
become the largest source of energy in 2035-2040, surpassing oil. Among
renewable sources, wind represents about two-thirds of total renewable
energy in 2040.
- Despite
the decrease in final energy consumption by transport, biofuels increase
by 37% over the Outlook. In addition, electricity consumption in transport
increases by around 700% over 2017-2040.
- Coal
and nuclear consumption fall significantly (-66% and -46%, respectively)
largely driven by policy.
- Production
of fossil fuels all see robust declines: oil (-28%), natural gas (-52%)
and coal (-73%).
- The
decline in natural gas production leads to a deterioration
self-sufficiency, with the import ratio rising from 75% to 88%.
- Energy
intensity decreases by 35%, in line with the global average for 2017-2040.
- Carbon
emissions decrease sharply (-36%) due to the decline in demand and the
shift toward a cleaner energy mix.
Full BP Energy Outlook here:


 «The Baltic Course» Is Sold and Stays in Business!

