
Analytics, Baltic States – CIS, Direct Speech, Energy, EU – Baltic States, Gas
International Internet Magazine. Baltic States news & analytics
Tuesday, 14.07.2026, 21:08
EU Gas Import Infrastructure – why more is good and why looking at annual utilisation figures alone is wrong - Part I
 Print version
It is a fact of life that gas demand tends to be higher on a cold winter’s day than on a warm summer’s day in Europe.
It is obvious why – although much gas is used for industrial processes whose demand may be relatively constant throughout the year, much gas is also used for heating, whether of offices or homes. A third major use of gas is power generation, but this too can vary. For example gas fired generation is increasingly used as a back up to renewables. Sometimes a cold winter’s day can coincide with little or no wind. On these days gas demand for power generation increases significantly as gas is required to make up for lack of renewables generation. It is also notable that, even during the winter period, gas demand can vary significantly.
This can easily be illustrated using analysis prepared by the ENTSOG[1], the European Network of Transmission Operators for Gas organisation.
The first chart shows total daily demand for gas across the EU during the winter period, the six months from October to March.
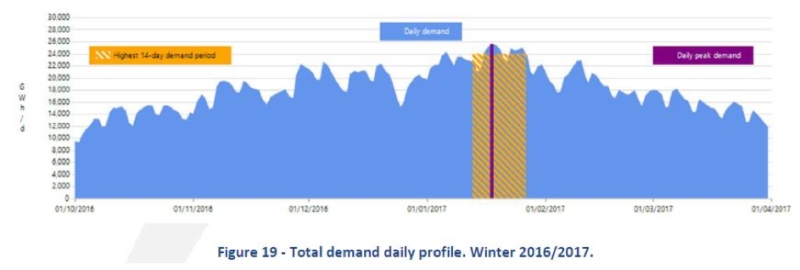
Source: “Winter Review 2016/2017” European Network of Transmission Operators for Gas. October 2017. Page 13.
Demand at the start of winter period was about 9000 GWhd. But demand on the coldest day was over 25000 GWhd, over two and a half times as much.
When looking at Final Consumption (that is gas used by industry, commerce and households) the picture is even more stark.
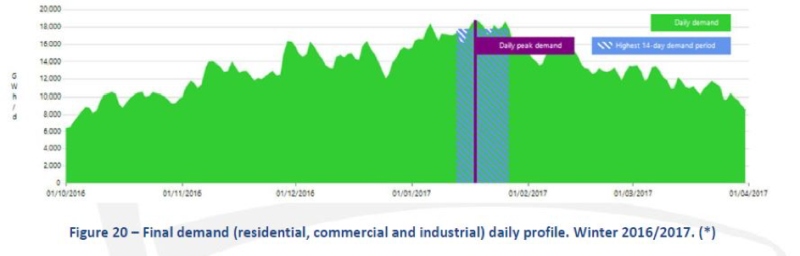
Source: “Winter Review 2016/2017” European Network of Transmission Operators for Gas. October 2017. Page 13.
Here the variation in Final Consumption was even greater, with demand on the coldest day of the winter period more than three times demand on the warmest day.
Demand for gas in power generation also varies by a factor of more than two between the lowest demand day and the highest. However here the pattern is not seasonal, with the lowest demand day in December. This shows how it is mainly the availability of other sources of power generation (e.g. renewables) which determines demand for gas in this sector, rather than temperature which drives peak day demand for non-power generation demand. As renewables become ever more important in the generation mix, and other sources of generation such as coal decline, we can expect this variation in gas demand for power to increase.
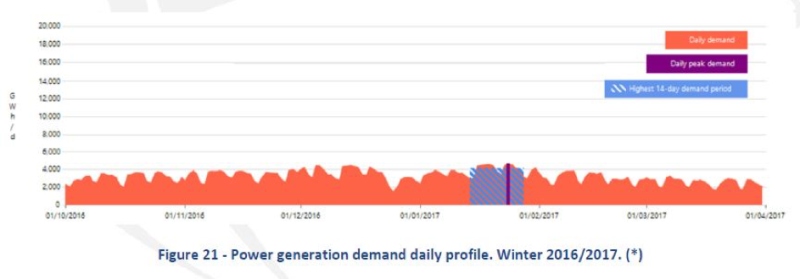
Source: “Winter Review 2016/2017” European Network of Transmission Operators for Gas. October 2017. Page 13.
Lastly, the following chart from ENTSOG and Gas Infrastructure Europe (GIE) shows that gas demand on the highest demand day in the year is three and a half times gas demand on the lowest demand day.
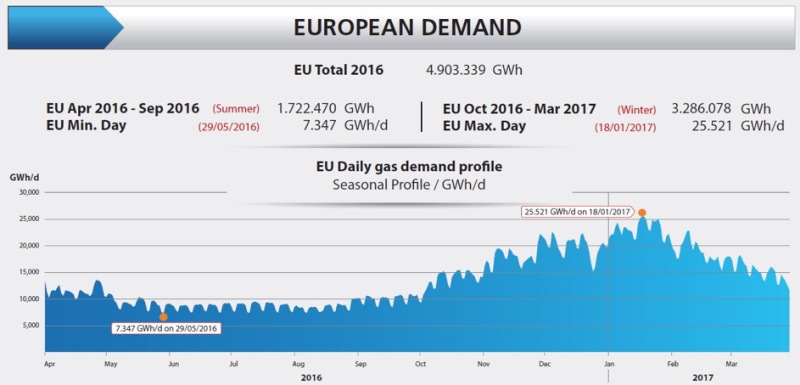
Source: ENTSOG GIE System Development Map 2016-17.
What the above means in practice is that gas pipelines are always in aggregate likely to have less than 100% utilisation over the year, simply because the need to meet peak day demand requires pipelines that are bigger than annual average flows would imply.
The short-term price inelasticity of gas demand (i.e. the inability of many gas consumers to find alternative fuel sources and thus reduce demand in the short term) means that gas prices quickly spike if supply cannot meet demand on a day. For example UK gas prices[2]peaked at 107.437 €/MWh on 1st March 2018, more than 5 times higher than their low during the two week period covering 28th February to 14th March 2018. The cause was the extreme cold weather and a “gas deficit warning” issued by National Grid because of limited supplies via pipeline. The UK market responded by bringing in more LNG, which helped cover the gap. In this sense the market worked, but prices had to go very high to attract the necessary cargoes. European buyers of LNG have to compete with other LNG buyers in the world, many of whom do not have the benefit of alternative pipeline supplies. They are therefore willing to pay high prices to attract sufficient LNG.
However, even when market prices go high, it may not be sufficient to attract LNG in a timely fashion. In a previous article[3], I explained what happened in Southern Europe when there was insufficient LNG to meet demand, based on a report by the International Energy Agency. Southern France, Spain and Greece were unable to import enough LNG at the right time but unlike Northern France and Italy, they did not have “spare” pipeline capacity to help meet the spike in demand. The result was that gas prices increased dramatically.
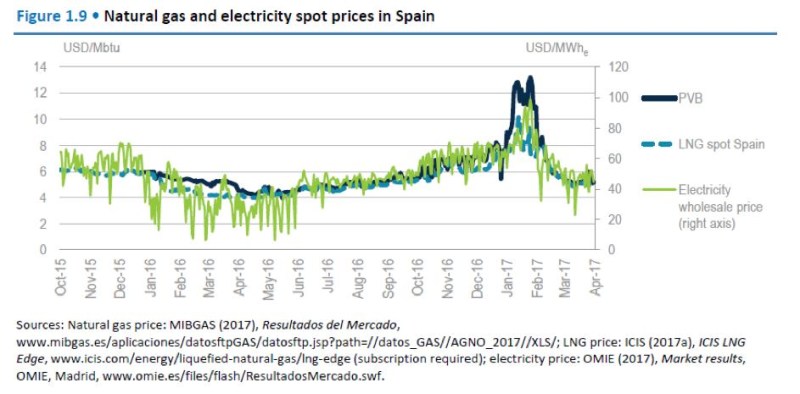
Source: International Energy Agency Global Gas Security Review 2017 page 21.
In this case, the Spanish traded gas price, PVB, more than doubled. The UK and Spanish examples both clearly show the consequences of not having sufficient supply available on the day.
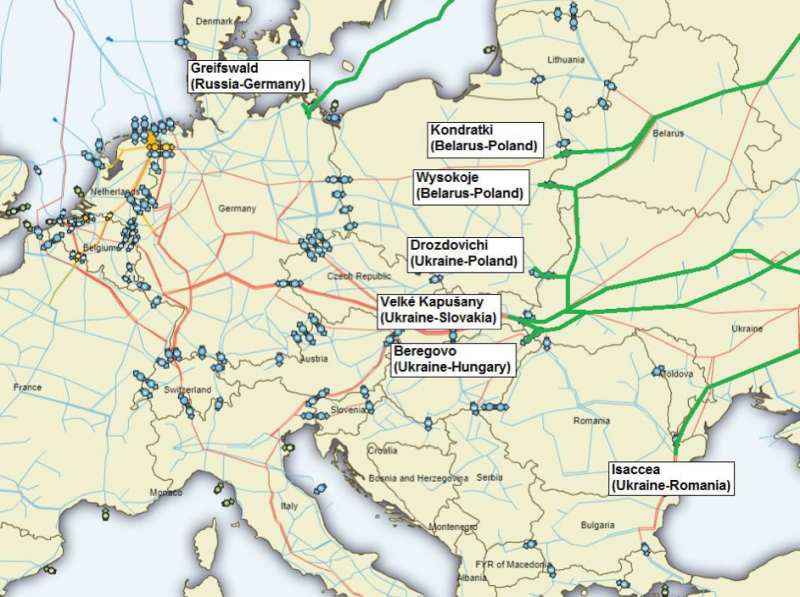
So how much spare capacity is there to import Russian gas? Russian gas supplies about one third of the EU market, and helped ensure that there was sufficient gas to meet record demand during the cold snap in February / March this year. Recent research by the Oxford Institute of Energy Studies[4]shows how Gazprom has used existing capacity and how that capacity is full. The report analyses flows and capacities based on publically available information from ENTSOG, the European Network of Transmission System Operators for Gas. The map below shows the different entry points for Russian gas into Europe.
Using ENTSOG data on capacities and flows, the report then calculates utilisation figures, as shown below:
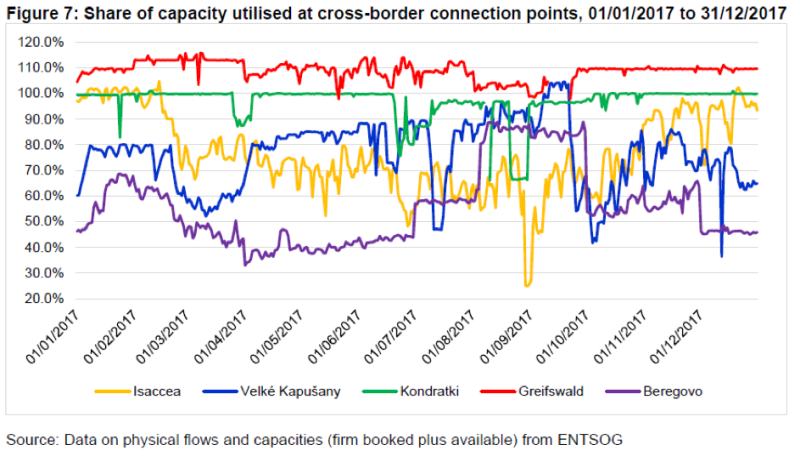
The report shows that the routes using Yamal (entry point into the EU at Kondrakti on the Belarus – Polish border) and Nord Stream (entry point at Greifswald in Germany) are both full throughout the year. The other routes are used more flexibly. For example, the route to South East Europe and Turkey, which enters the EU at Isaccea, is highly seasonal with flows above 100%[5]in the winter period. The main route via Ukraine which enters the EU at Veľké Kapušany also has utilisation rates above 100% but these tend to be during the spring and summer months (April through to September). In particular, the report notes that utilisation rates for Veľké Kapušany were on average 95% between 8th August 2017 and 21st September 2017.
Moreover, utilisation rates peaked at 101%-105% between 11th Whzand 21st September 2017, the period when Nord Stream was on maintenance. [6]
The report concludes that “this suggest that Veľké Kapušany was used to refill storage facilities in Europe in the summer and throughout the year as back up for other pipeline infrastructure, rather than as capacity to be ramped up during the periods of peak winter demand.”[7]Storage has always been an important means of meeting peak day demand. However, storage capacity and send out is also finite, so the problem of price spikes remains if storage and / or pipeline capacity is not sufficient. Some countries, for example the UK, have very little storage and therefore rely on pipeline flexibility (e.g. interconnectors with continental Europe) and / or LNG. It can also be the case if there is a surge in demand at the end of the winter period when storage levels are depleted. The importance of pipeline flexibility is clearly illustrated by the fact that utilisation of all Russian import routes to Europe peaked at 85% on 2nd March 2018 during the very cold weather.[8]
Therefore, what conclusions can we draw from the above? Firstly, assertions that Europe has sufficient pipeline capacity based on annual utilisation figures do not give the full picture as they fail to take account of the significant variations of gas demand during a year. Lack of sufficient capacity to meet gas demand on peak days leads to price spikes, and ultimately supply interruptions. Secondly, the assertion that there is plenty of existing capacity to import Russian gas is also misplaced. Current routes are running at or near full capacity today. However, Europe will need to import more gas in the future as current sources of supply decline. At least some of this gas will be from Russia, the precise quantity to be determined by market forces. Nevertheless, if Europe is to avoid the type of price spikes I describe above, additional import capacity such as that provided by Nord Stream 2 will be required. In a future article, I will explain in more detail how “spare” capacity for imports is not only necessary but also an inevitable consequence of the competitive European gas market. However, for now it is sufficient to say that spare import capacity, whether it is LNG or pipeline, enables European consumers to get the best deal. Limiting such capacity makes it easier for external suppliers to put up prices.
[1]“Winter Review 2016/2017” European Network of Transmission Operators for Gas. October 2017.
[2]NBP Day Ahead. Taken from ICIS European Gas Markets 15th March 2018 page 18.
[3]A Barnes “LNG is not a panacea for European Security of Supply.” 7th November 2017
[4]Jack Sharples “Ukrainian Transit: Still Vital for Russian Gas Supplies to Europe as Other Routes Reach Full Capacity.” Oxford Institute for Energy Studies May 2018.
[5] Flows of above 100% are possible because of the definitions of capacity under EU rules. Transmission System Operators (TSOs) have to publish the “technical” capacity at each entry or exit point that they are prepared to make available. This capacity is “firm” i.e. companies using the system can be sure that a given level of capacity is available. However, depending on circumstances, such as flows at other points in the system, TSOs can enable flows of more than this “firm” level of capacity but cannot guarantee that this will always be possible, using so called “interruptible” capacity.
The ENTSOG capacity data is based on the entry points to the EU and the “technical” level of capacity that TSOs offer, whilst the flow data is based on actual flows observed at these entry points, hence figures of more than 100% utilisation.
[6]Jack Sharples “Ukrainian Transit: Still Vital for Russian Gas Supplies to Europe as Other Routes Reach Full Capacity.” Oxford Institute for Energy Studies May 2018. Page 8
[7]Ibid.
[8]Ibid. Appendix 1 Page 10.
The article published on Linkedin portal.


 «The Baltic Course» Is Sold and Stays in Business!