
Analytics, Baltic, Direct Speech, Economics, EU – Baltic States, EU – CIS, Statistics
International Internet Magazine. Baltic States news & analytics
Friday, 26.04.2024, 05:37
The economic development of the Baltic Sea Region - what major indicators tell us
 Print version
 |
|---|
And, indeed, for more than fifteen years, the Baltic Sea
Region developed at high speed, the Baltic states (Estonia, Latvia, Lithuania) and
Poland joined the European Union, and the Baltic Sea Region was deemed “one of
the most dynamic economic areas of Europe.”
At the same time, however, the region’s prosperity remained
below peer regions; and analysts repeatedly pointed at performance imbalances
between member countries and improvement needed regarding different aspects of
economic performance, such as GDP, competitiveness, digitalization, employment,
inflation, sustainability, or wealth.
For gaining a clearer picture of the BSR’s economic
performance since the mid-2000s, two types of data were considered: firstly,
the traditional macro-economic indicatorsof GDP, GDP per capita and FDI, and
secondly, more modern indices/rankings, viz. the Global Competitiveness Index,
the Ease of Doing Business Index, the Economic Freedom Index, the European
Innovation Scoreboard, the World Investment Report, the Global Cleantech
Innovation Index, and the Networked Readiness Index.
GDP and GDP per capita
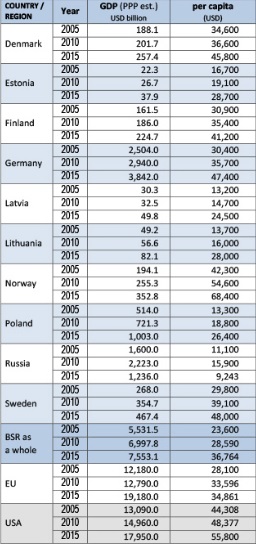
The below table lists the values of the 10 BSR states, the
overall performance of the region, the values of the European Union and of the
United States[1]
As can be seen, all Baltic Rim countries - except Russia -
exhibit continuous growth; and in 2015 the BSR GDP per capita average exceeded
the EU average. This good result loses its lustre, however, when compared with
the US performance and a gap of about 50%.
But even within the BSR, the long-standing East-West divide
is still present, although it has narrowed somewhat – in 2005, the GDP per
capita average of Estonia, Latvia, Lithuania, Poland, and Russia amounted to
38% of that of Denmark, Finland, Germany, Norway and Sweden; and in 2015 it
amounted to 46% (54% if one excludes Russia’s performance).
Competitiveness
The Global Competitiveness Indexcompiled and published by
the WORLD ECONOMIC FORUM is a cross-country benchmarking analysis of the
factors and institutions that are perceived as determining long-term growth and
prosperity.
While in 2005,four BSR countries (Denmark, Finland, Germany,
and Sweden) made it into the Top 10 group (with Norway on rank 12 being close),
whereas the positions of Estonia (25), Latvia (36), Lithuania (40), Poland (48)
and Russia (62) were far behind – with a BSR average of 24; in 2016, it was
Germany, Lithuania, Norway and Poland that had improved their performance,
whereas all other BSR member states had lost ground, with the BSR average being
22.5, a very modest improvement.
Ease of Doing Business
The Ease of Doing Business Index compiled by the WORLD BANK ranks
economies regarding ten factors that contribute to a business-friendly
environment conducive to the starting and operation of local firms., such as
starting a business, obtaining construction permits or getting electricity.
The performance of the Baltic Sea Region in 2016 was as follows:
Denmark – rank 3 (from 8 in 2005), Estonia – rank 12 (from 16 in 2005), Finland
– rank 13 (stable compared with 2005), Germany – rank 17 (up in performance
from 19 in 2005), Lithuania – rank 21( 15 in 2005), Latvia – rank 14 (26 in
2005), Norway – rank 6 (rank 5 in 2005), Poland – rank 24 (an impressive
improvement from 54 in 2005), Russia – rank 40 (up from 79 in 2005), and Sweden
– rank 9 (up from rank 14 in 2005). The BSR average moved up nearly 10 ranks
from 25 in 2005 to 16 in 2016; and gaps between the best performers and
countries on lower ranks are narrowing.
As can be seen, all Baltic Rim countries - except Russia -
exhibit continuous growth; and in 2015 the BSR GDP per capita average exceeded
the EU average. This good result loses its lustre, however, when compared with
the US performance and a gap of about 50%. But even within the BSR, the
long-standing East-West divide is still present, although it has narrowed
somewhat – in 2005, the GDP per capita average of Estonia, Latvia, Lithuania,
Poland, and Russia amounted to 38% of that of Denmark, Finland, Germany, Norway
and Sweden; and in 2015 it amounted to 46% (54% if one excludes Russia’s
performance).
Competitiveness
The Global Competitiveness Index compiled and published by
the WORLD ECONOMIC FORUM is a cross-country benchmarking analysis of the
factors and institutions that are perceived as determining long-term growth and
prosperity.
While in 2005,four BSR countries (Denmark, Finland, Germany,
and Sweden) made it into the Top 10 group (with Norway on rank 12 being close),
whereas the positions of Estonia (25), Latvia (36), Lithuania (40), Poland (48)
and Russia (62) were far behind – with a BSR average of 24; in 2016, it was
Germany, Lithuania, Norway and Poland that had improved their performance,
whereas all other BSR member states had lost ground, with the BSR average being
22.5, a very modest improvement.
Ease of Doing Business
The Ease of Doing Business Index compiled by the WORLD BANK ranks
economies regarding ten factors that contribute to a business-friendly
environment conducive to the starting and operation of local firms, such as
starting a business, obtaining construction permits or getting electricity. The
performance of the Baltic Sea Region in 2016 was as follows: Denmark – rank 3
(from 8 in 2005), Estonia – rank 12 (from 16 in 2005), Finland – rank 13
(stable compared with 2005), Germany – rank 17 (up in performance from 19 in
2005), Lithuania – rank 21( 15 in 2005), Latvia – rank 14 (26 in 2005), Norway
– rank 6 (rank 5 in 2005), Poland – rank 24 (an impressive improvement from 54
in 2005), Russia – rank 40 (up from 79 in 2005), and Sweden – rank 9 (up from
rank 14 in 2005). The BSR average moved up nearly 10 ranks from 25 in 2005 to
16 in 2016; and gaps between the best performers and countries on lower ranks
are narrowing.
Economic Freedom
Innovation
For detecting trends regarding innovation, two sources were
used – The European Innovation scoreboard/Innovation Union Scoreboard and the Global
Cleantech 100 List.
The European Innovation scoreboard/Innovation Union Scoreboard(since
2011) is an instrument of the EUROPEAN COMMISSION, developed under the Lisbon
Strategy to provide a comparative assessment of the performance of EU Member
States.
According to the 2016 Scoreboard, Denmark, Finland, Germany,
and Sweden are Innovation Leaders with innovation performance well above that
of the EU average. Austria, Belgium, France, Ireland, Estonia, Latvia,
Lithuania, and Poland, on the other hand, are only Moderate Innovators with a
performance below that of the EU average.
Apart from the BSR being divided into two categories, the
comparison of the values for 2008 and 2014 shows an improvement when 2008 is
taken as the base year for all EU BSR countries except Finland, but a
deterioration when 2015 is compared with 2014 for all countries except Denmark,
Poland, and Sweden.
The Global Cleantech 100 Listis a biennial report compiled
by CLEANTECH GROUP. In it 100 companies (chosen from several thousand) are
presented, which are seen as best-positioned to solve clean technology
challenges and to disrupt the markets they innovate in. Assuming the assessment
is unbiased, the figures are sobering.
In 2010, the United States can boast 54 companies in this
list, the figure for the entire BSR amounts to 14, and Estonia, Latvia, Lithuania,
Poland and Russia are not represented at all. But in 2015, the situation has
even worsened – only 9 BSR companies are included, whereas the US figure has
risen to 57.
Since Norway and Russia are not members of the EU, their
performance is not included.
Information and Communication Technology
Analyses of economic performance frequently address the
issue of how well-prepared economic actors are for the IT-driven Fourth Industrial
Revolution.
An index measuring how well an economy is using information and
communications technologies to boost competitiveness and well-being is the
WORLD ECONOMIC FORUM’s Networked Readiness Index.
Here, the BSR performance is much more satisfactory, not
only because the values have improved noticeably, but also because the gap to
the United States is shrinking. In 2010 the BSR average was 4.71 (with the
maximum value possible being 6.0), whereas the USA value was 5.33. In 2016, the
BSR value was 5.30 versus 5.8 (USA).
Investment
To gauge performance regarding attractiveness to investors,
information in UNCTAD’s World Investment Reportwas utilised to calculate FDI
inward stock per capita for the BSR and compare it with that of the USA.
Unfortunately, the results are thoroughly satisfactory only for Denmark, whose
figures (2010 – 2015) have grown and are better than the USA’s. Norway’s and
Sweden’s figures both in 2010 and 2015 are better than those of the USA, but
they are lower in 2015 than in 2010.
Conclusion & Suggestions
Conclusion & Suggestions
1) The BSR overall economic performance has not developed as
well as we had hoped.
2) The East-West divide in performance is still in
existence.
3) Russia’s figures in most categories give reason for
special concern.
4) While the intra-European comparison is acceptable, the
global perspective highlights BSR shortcomings.
5) Hence, we need to rekindle the enthusiasm of the early
1990s to cope with the current and future challenges and all efforts need to be
made to create a novel perception of unity in the BSR.
6) Various suggestions presented in articles in the Baltic
Rim Economies, should be picked up and implemented, e.g. a common BSR innovation
strategy or a BSR media channel.


 «The Baltic Course» Is Sold and Stays in Business!