
Estonia, Foreign trade , Good for Business, Statistics
International Internet Magazine. Baltic States news & analytics
Wednesday, 20.05.2026, 17:00
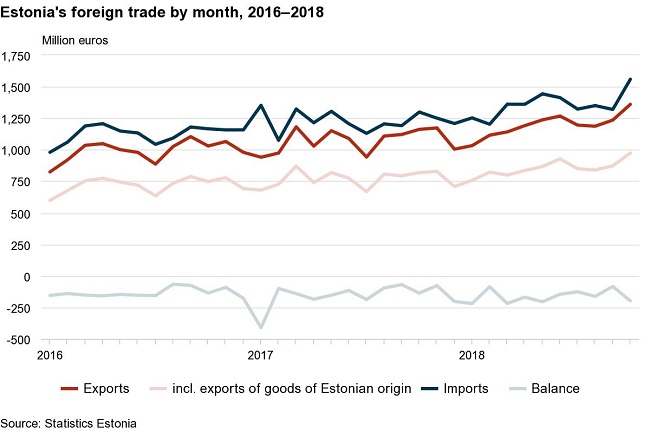
In October, trade was at a record level in Estonia
 Print version
In October 2018, exports from Estonia amounted to 1.36 bln
euros and imports to Estonia to 1.56 bln euros at current prices. The
trade deficit was 199 mln euros, which is 62 mln euros more than in October
2017.
In October 2018, the top destination countries of Estonia’s
exports were Finland (16% of Estonia’s total exports of goods), the USA (11%)
and Sweden (10%). Electrical equipment and base metals and articles of base
metal were the main commodities exported to Finland; electrical equipment and
mineral products were the main commodities exported to the USA; wood and
articles of wood and miscellaneous manufactured articles were the main
commodities exported to Sweden. The biggest increase occurred in exports
to the USA (up by 110 mln euros), Denmark (up by 22 mln euros) and Latvia
(up by 21 mln euros). In exports to the USA, the exports of data communication
equipment increased the most. There was also an increase in the exports of
shale oil to Denmark and of electricity to Latvia. The biggest decrease
occurred in exports to Germany (down by 35 mln euros).
In October, the biggest share in the exports of goods was
held by electrical equipment and mineral products (both 17% of the total
exports of goods), followed by wood and articles of wood (11%). The greatest
increase was in the exports of mineral products (up by 140 mln euros),
electrical equipment (up by 39 mln euros) and wood and articles of wood (up by
16 mln euros). The biggest decrease occurred in the exports of transport
equipment (down by 24 mln euros) and agricultural products and food
preparations (down by 16 mln euros).
The share of goods of Estonian origin in total exports of
goods was 72% in October 2018. The exports of goods of Estonian origin
increased by 19% and re-exports by 12% compared to October 2017. In the exports
of goods of Estonian origin, the greatest increase was in the exports of
mineral products (solvent, shale oil), electrical equipment (data communication
equipment), and wood and articles of wood (wood pellets, birch pulpwood). The
share of goods of Estonian origin accounted for 59% of the exports of mineral
products.
The main countries of consignment in October 2018 were
Finland (12% of Estonia’s total imports of goods), Lithuania (11%), Germany and
Russia (10% each). From Finland, mineral products and electrical equipment were
imported the most. Mineral products and raw materials and products of chemical
industry were imported the most from Lithuania and Russia, and electrical
equipment and transport equipment from Germany. The biggest increase occurred
in imports from Russia (up by 71 mln euros), Lithuania (up by 44 mln
euros) and Finland (up by 30 mln euros). From Russia, Lithuania and Finland,
the imports of mineral products (fuel additives, motor spirit) increased most.
The main commodities imported to Estonia were mineral
products (18% of Estonia’s total imports of goods), electrical equipment (14%)
and mechanical appliances, transport equipment, agricultural products and food
preparations, and base metals and articles of base metal (each 9%). The
greatest increase was in the imports of mineral products (up by 153 mln euros),
electrical equipment and mechanical appliances (up by 21 mln euros).
In October 2018, the foreign trade export volume index
increased by 3% and the import volume index by 2% compared to October 2017.
| Month | Exports, million euros | Imports, million euros | Balance, million euros | |||||
|---|---|---|---|---|---|---|---|---|
| 2017 | 2018 | change, % | 2017 | 2018 | change, % | 2017 | 2018 | |
| TOTAL | 10,698 | 11,963 | 12 | 12,300 | 13,585 | 10 | -1,602 | -1,622 |
| January | 941 | 1,032 | 10 | 1,352 | 1,253 | -7 | -412 | -220 |
| February | 974 | 1,116 | 15 | 1,075 | 1,203 | 12 | -101 | -87 |
| March | 1,182 | 1,142 | -3 | 1,323 | 1,361 | 3 | -141 | -220 |
| April | 1,029 | 1,191 | 16 | 1,214 | 1,361 | 12 | -186 | -169 |
| May | 1,151 | 1,237 | 7 | 1,305 | 1,443 | 11 | -154 | -206 |
| June | 1,089 | 1,267 | 16 | 1,206 | 1,414 | 17 | -117 | -146 |
| July | 942 | 1,195 | 27 | 1,130 | 1,322 | 17 | -188 | -127 |
| August | 1,109 | 1,187 | 7 | 1,205 | 1,350 | 12 | -96 | -163 |
| September | 1,121 | 1,235 | 10 | 1,191 | 1,320 | 11 | -70 | -84 |
| October | 1,162 | 1,360 | 17 | 1,299 | 1,560 | 20 | -137 | -199 |
| Country of destination, group of countries | Exports, million euros | Share, % | Change on same month of previous year, % | Country of consignment, group of countries | Imports, million euros | Share, % | Change on same month of previous year, % |
|---|---|---|---|---|---|---|---|
| TOTAL | 1,360 | 100 | 17 | TOTAL | 1,560 | 100 | 20 |
| EU-28 | 897 | 66 | 8 | EU-28 | 1,206 | 77 | 11 |
| Euro area 19 | 615 | 45 | 5 | Euro area 19 | 865 | 55 | 8 |
| Non-EU | 463 | 34 | 39 | Non-EU | 353 | 23 | 69 |
| 1. Finland | 214 | 16 | 9 | 1. Finland | 193 | 12 | 19 |
| 2. USA | 149 | 11 | - | 2. Lithuania | 176 | 11 | 33 |
| 3. Sweden | 141 | 10 | 1 | 3. Germany | 157 | 10 | 8 |
| 4. Latvia | 123 | 9 | 21 | 4. Russia | 152 | 10 | 88 |
| 5. Germany | 74 | 5 | -32 | 5. Sweden | 134 | 9 | 21 |
| 6. Lithuania | 69 | 5 | 3 | 6. Latvia | 126 | 8 | -2 |
| 7. Russia | 69 | 5 | -17 | 7. Poland | 92 | 6 | 9 |
| 8. Denmark | 58 | 4 | 60 | 8. Netherlands | 68 | 4 | -19 |
| 9. Norway | 53 | 4 | 5 | 9. China | 54 | 3 | 27 |
| 10. Singapore | 39 | 3 | 91 | 10. United Kingdom | 50 | 3 | 63 |
| Commodity section (chapter) by Combined Nomenclature (CN) | Exports | Imports | Balance, million euros | ||||
|---|---|---|---|---|---|---|---|
| million euros | share, % | change on same period of previous year, % | million euros | share, % | change on same period of previous year, % | ||
| TOTAL | 1,360 | 100 | 17 | 1,560 | 100 | 20 | -199 |
| Agricultural products and food preparations (I–IV) | 102 | 7 | -13 | 138 | 9 | 1 | -36 |
| Mineral products (V) | 225 | 17 | - | 283 | 18 | 118 | -58 |
| Raw materials and products of chemical industry (VI) | 67 | 5 | 1 | 127 | 8 | 9 | -60 |
| Articles of plastics and rubber (VII) | 42 | 3 | 2 | 84 | 5 | 15 | -42 |
| Wood and articles of wood (IX) | 146 | 11 | 12 | 54 | 3 | 15 | 93 |
| Paper and articles thereof (X) | 32 | 2 | 9 | 25 | 2 | 5 | 6 |
| Textiles and textile articles (XI) | 35 | 2 | -1 | 68 | 4 | 15 | -34 |
| Base metals and articles of base metal (XV) | 110 | 8 | 5 | 134 | 9 | 12 | -24 |
| Mechanical appliances (84) | 111 | 8 | 12 | 144 | 9 | 17 | -33 |
| Electrical equipment (85) | 225 | 17 | 21 | 220 | 14 | 11 | 5 |
| Transport equipment (XVII) | 75 | 6 | -24 | 140 | 9 | -5 | -65 |
| Optical, measuring, precision instruments (XVIII) | 39 | 3 | 11 | 37 | 3 | 17 | 2 |
| Miscellaneous manufactured articles (XX) | 112 | 8 | 14 | 41 | 3 | 3 | 72 |
| Other | 42 | 3 | 14 | 66 | 4 | 22 | -24 |


 «The Baltic Course» Is Sold and Stays in Business!
