Analytics, Estonia, Financial Services, Society
International Internet Magazine. Baltic States news & analytics
Friday, 13.02.2026, 11:47
20.7% Estonians lived at risk of poverty in 2019
 Print version
According to Anet Müürsoo, leading analyst at Statistics Estonia, absolute poverty indicates the share of the population who are not able to meet their basic needs. “Last year, 30,500 people lived in absolute poverty, meaning that their equivalised monthly income was less than 221 euros,” said Müürsoo.
The at-risk-of-poverty rate reflects income inequality in a country. In 2019, there were 272,700 persons at risk of poverty, as their equivalised monthly income was less than 611 euros. “Essentially, a person at risk of poverty may have a good income, but the inequality arises from the fact that other people have an even higher income,” explained Müürsoo.
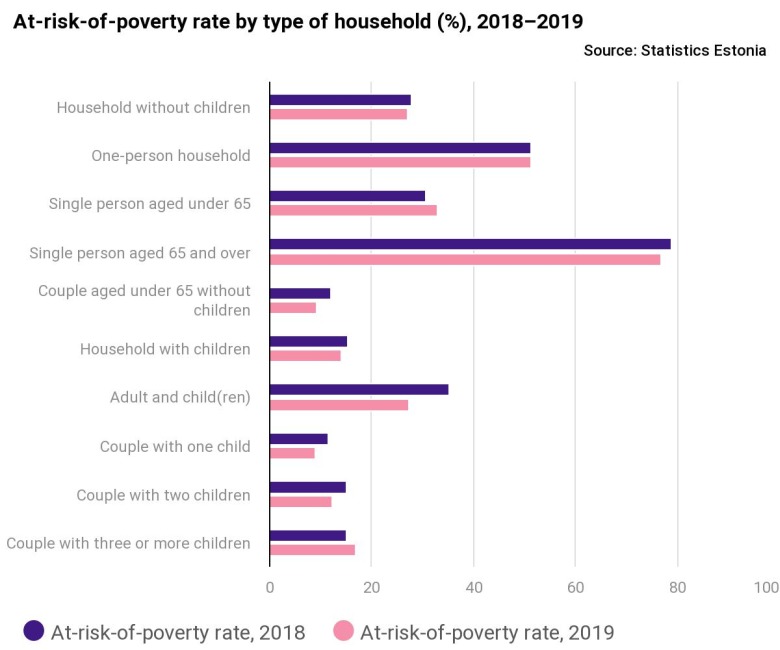
Year on year, the at-risk-of-poverty rate has decreased the most among the elderly and children, and it has increased the most among young people. The at-risk-of-poverty rate is the highest among single persons aged 65 and older. “Compared to 2018, there has been a fall in the number of single parents who are at risk of poverty, while the number of couples with three or more children who are at risk of poverty has increased. The absolute poverty rate has risen among children and young people, but it decreased in the age group 50–64,” added Müürsoo.

The at-risk-of-poverty rate is the highest in Hiiu (31.7%), Valga (30.3%) and Ida-Viru (29.3%) counties. It is the lowest in Harju (15.7%), Saare (19.2%) and Lääne-Viru (19.6%) counties.
In 2020, the share of people living in deprivation – i.e. people who cannot afford various items commonly available in the society – was 6.5% of the population, which is 1.2 percentage points less than the year before. The deprivation rate was the highest among 50–64-year-olds (9%) and the lowest among 25–49-year-olds (4.7%). The deprivation rate decreased the most among single persons aged 65 and older and among single parents.
The estimations are based on the data of the 2020 Estonian Social Survey. The main representative of public interest for this statistical activity is the Ministry of Social Affairs. 6,434 households participated in the survey. The survey collects data about yearly income, which is why the 2020 survey asked respondents about the income in 2019. The yearly income is necessary for calculating the indicators of poverty and inequality. The social survey (called EU-SILC) is conducted in all European Union countries on the basis of a harmonised methodology.
At-risk-of-poverty rate is the share of persons with an equivalised yearly disposable income lower than the at-risk-of poverty threshold. The at-risk-of-poverty threshold is 60% of the median equivalised yearly disposable income of household members. Equivalised disposable income is the total household income which is divided by the sum of equivalence scales of all household members.
Deprivation rate is the share of persons who cannot afford at least 5 of the 13 items: 1) to pay rent or utility bills, 2) to keep their home adequately warm, 3) to face unexpected expenses, 4) to eat meat, fish or a protein equivalent every second day, 5) a one-week holiday away from home, 6) a car, 7) to replace furniture when worn out or damaged, 8) to replace worn-out clothes with new ones, 9) to have at least two pairs of outdoor shoes in good condition that are necessary in our climate, 10) to spend a small amount of money each week on oneself, 11) to participate regularly in a leisure activity that costs money, 12) to get together with friends or family for a drink or meal at least once a month, or 13) to have an internet connection at home for personal use when needed.
More information about the methodology used to measure deprivation can be found here: New material deprivation indicator
More detailed data have been published in the statistical database.
- 25.01.2021 Как банкиры 90-х делили «золотую милю» в Юрмале
- 29.12.2020 В Латвии вводят комендантский час, ЧС продлена до 7 февраля
- 29.12.2020 В Rietumu и в этот раз создали особые праздничные открытки и календари 2021
- 29.12.2020 Latvia to impose curfew, state of emergency to be extended until February 7
- 29.12.2020 Lithuanian president signs 2021 budget bill into law
- 29.12.2020 Number of new companies registered in Estonia up in 2020
- 29.12.2020 Президент Литвы утвердил бюджет 2021 года
- 28.12.2020 Рынок недвижимости Эстонии осенью начал быстро восстанавливаться
- 28.12.2020 Tartu to support students' solar car project
- 28.12.2020 New Year Cards and Calendars of Rietumu Bank presented


 «The Baltic Course» Is Sold and Stays in Business!

