
Analytics, Baltic Export, Baltic States – CIS, EU – Baltic States, Foreign trade , Latvia, Markets and Companies
International Internet Magazine. Baltic States news & analytics
Saturday, 14.06.2025, 00:13
In March, foreign trade turnover in Latvia decreased by 5.1%
 Print version
During the first quarter of this year foreign trade
turnover of Latvia at current prices reached EUR 6.87 billion –
EUR 20.3 million or 0.3% more than in the corresponding period of the
previous year. The exports value constituted EUR 3.23 billion (a
growth of EUR 110.1 million or 3.5%), whereas the imports value
comprised EUR 3.64 billion (a drop of EUR 89.8 million or
2.4%).
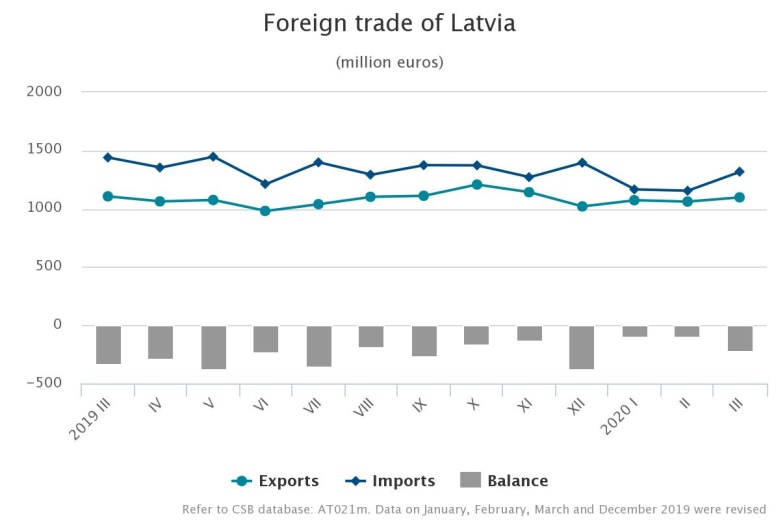
Calendar and seasonally adjusted data show that,
compared to March 2019, in March 2020 the exports value at current
prices went down by 3% and the imports value by 12.3%, whereas, compared to the
previous month, the exports value went down by 3.2% and the imports value by 3%.
Main changes in exports in March 2020, compared
to March 2019:
- exports of vegetable products up by EUR 23.6 million or 37.5%,
- exports of prepared foodstuffs up by EUR 14.8 million or 16.1%,
- exports of wood and articles of wood down by EUR 31.5 million or 14.8%,
- exports of vehicles and associated transport equipment down by EUR 20.3 million or 27.6%,
- exports of mineral products down by EUR 15 million or 24.8%.
Main changes in imports in March 2020, compared
to March 2019:
- imports of prepared foodstuffs up by EUR 22.7 million or 20.6%,
- imports of products of the chemical and allied industries up by EUR 20.3 million or 12.8%,
- imports of machinery and mechanical appliances; electrical
equipment up by
EUR 16 million or 6.2%,
- imports of vehicles and associated transport equipment down by EUR 179.8 million or 61.3%,
- imports of mineral products down
by EUR 9.5 million or 11.1%.
In March 2020, as compared to February,
epidemiological crisis caused by coronavirus Covid-19 had affected trade with
certain specific goods. Thus, imports of protective oral-nasal masks rose from
EUR 473.7 thousand to EUR 1.2 million. Mainly, they were
imported from China (57.8% or in amount of EUR 709.1 thousand) and
from Sweden (16.7% or in amount of EUR 204.3 thousand). In turn, both
exports and imports of medicines have increased. Exports rose by
EUR 13 million or 51.4% and imports – by EUR 10.9 million
or 26.2%. Most of medicines were exported to Lithuania (13.2%), Estonia (9.9%),
Germany (9.8%) and Russia (9.1%). Largest imports of medicines were from
Lithuania (38.1%), Poland (7.8%) and Switzerland (7.6%).
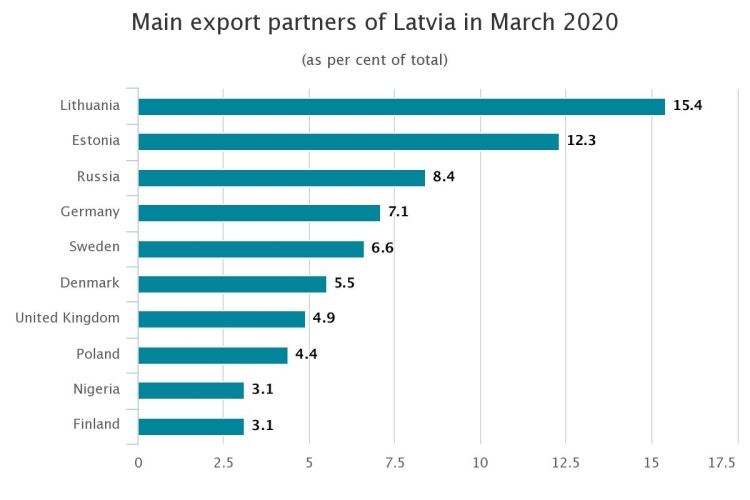
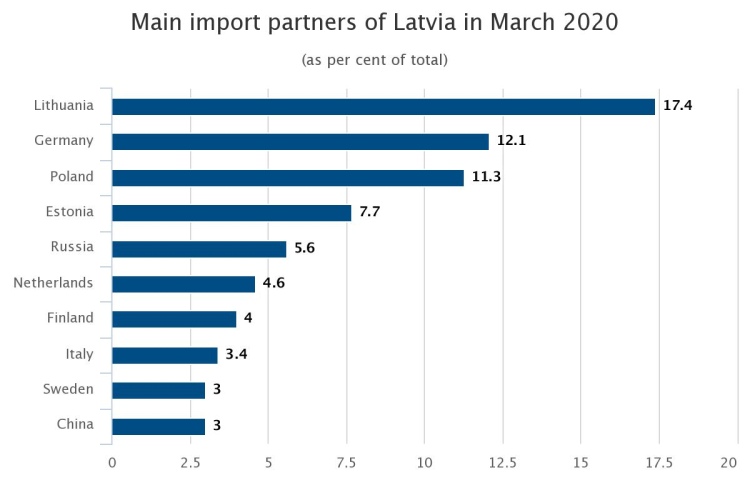
In March, the main export partners of Latvia in trade
with EU countries were Lithuania (15.4% of total exports), Estonia (12.3%),
Germany (7.1%) and Sweden (6.6%), whereas the main import partners were
Lithuania (17.4% of total imports), Germany (12.1%), Poland (11.3%) and Estonia
(7.7%). Russia was the main partner in trade with third countries; its share in
total Latvian exports in March accounted for 8.4%, whereas in imports – for 5.6%.
In March 2020, compared to March 2019, share of the European Union countries in total exports value fell by 0.4 percentage points, but in imports value – grew by 6.9 percentage points. Share of CIS countries in exports rose by 0.9 percentage points and 0.1 percentage point in imports.
Foreign trade of Latvia in March 2020 by country group
(at current prices)
|
|
Exports |
Imports |
||||
|
|
million EUR |
% of total |
changes as%, compared to March 2019 |
million EUR |
% of total |
changes as%, compared to March 2019 |
|
Total |
1 098.5 |
100 |
-0.7 |
1 318.7 |
100 |
-8.4 |
|
European Union countries* |
732.9 |
66.7 |
-1.3 |
1 043.4 |
79.1 |
0.3 |
|
euro area countries |
527.9 |
48.1 |
-2.1 |
762.7 |
57.8 |
1.1 |
|
CIS countries |
137.5 |
12.5 |
7.1 |
114.2 |
8.7 |
-8.2 |
|
other countries |
228.1 |
20.8 |
-3.1 |
161.1 |
12.2 |
-41.7 |
*As of 1 February 2020 the United Kingdom is not
included in the European Union.
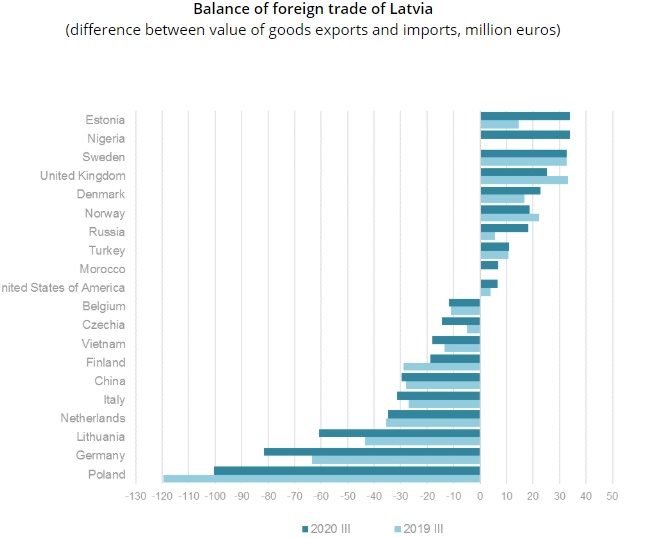
In March 2020 foreign trade balance of Latvia was
positive with 118 partner countries, as exports value of goods exceeded
imports value of goods. It was negative in trade with 45 countries.
The rise in exports of cereals in March 2020, as compared to March 2019, was facilitated by an increase in exports of wheat and meslin by EUR 12.6 million or 37.1% (majority was exported to Nigeria – EUR 33.5 million). In turn, reduction in exports of mineral fuels, mineral oils and products of their distillation was mostly influenced by decrease of exports of electricity by EUR 6.8 million or 50%.
Main commodities in exports of Latvia in March 2020
(at current prices)
|
|
thousand EUR |
% of total |
Changes as%, compared to |
||
|
March 2019 |
February 2020 |
average of previous 12 months |
|||
|
Total |
1 098 469 |
100 |
-0.7 |
3.5 |
1.5 |
|
181 572 |
16.5 |
-14.8 |
-0.4 |
-0.3 |
|
|
115 305 |
10.5 |
3.6 |
-9.6 |
-1.3 |
|
|
62 248 |
5.7 |
-5.0 |
-0.9 |
-5.0 |
|
|
53 770 |
4.9 |
39.0 |
86.7 |
19.6 |
|
|
vehicles other than railway or tramway rolling stock, and parts and
accessories thereof |
48 982 |
4.5 |
-24.2 |
-16.1 |
-15.0 |
|
47 081 |
4.3 |
20.3 |
44.4 |
19.8 |
|
|
44 957 |
4.1 |
-2.1 |
2.6 |
-18.2 |
|
|
44 074 |
4.0 |
-5.7 |
2.8 |
26.6 |
|
|
mineral fuels, mineral oils and products of their distillation |
42 002 |
3.8 |
-25.3 |
-1.7 |
-11.3 |
|
40 372 |
3.7 |
0.5 |
4.4 |
7.6 |
|
The rise in imports of alcoholic and non-alcoholic beverages in March 2020, as compared to March 2019, was facilitated by an increase in imports of whiskey by EUR 3.6 million or 31.9%. In turn, reduction in imports of iron and steel was mostly influenced by drop in imports of flat-rolled products of iron or non-alloy steel by EUR 3.6 million or 13.6%.
Main commodities in imports of Latvia in March 2020
(at current prices)
|
|
thousand EUR |
% of total |
Changes as%, compared to |
||
|
March 2019 |
February 2020 |
average of previous 12 months |
|||
|
Total |
1 318 690 |
100 |
-8.4 |
14.1 |
-0.4 |
|
137 805 |
10.5 |
5.9 |
-3.4 |
-3.3 |
|
|
128 978 |
9.8 |
0.9 |
7.0 |
2.8 |
|
|
vehicles other than railway or tramway rolling stock, and parts and
accessories thereof |
107 289 |
8.1 |
-7.0 |
22.7 |
-1.2 |
|
mineral fuels, mineral oils and products of their distillation |
71 647 |
5.4 |
-13.2 |
12.9 |
-36.0 |
|
64 429 |
4.9 |
1.1 |
29.1 |
20.1 |
|
|
57 911 |
4.4 |
4.1 |
14.6 |
8.2 |
|
|
49 184 |
3.7 |
11.0 |
44.9 |
1.6 |
|
|
48 660 |
3.7 |
-10.0 |
15.2 |
4.3 |
|
|
42 577 |
3.2 |
-14.9 |
-0.3 |
-6.1 |
|
|
35 139 |
2.7 |
7.6 |
13.9 |
6.3 |
|
More information on the foreign trade of Latvia by
month and quarter, as well as by country group and commodity group is available
in the “Foreign trade” section of the
CSB database.
- 28.01.2022 BONO aims at a billion!
- 26.08.2021 LLC Dizozols Investments finalizes investment attraction deal with Crowdestor with record-high profits
- 25.01.2021 Как банкиры 90-х делили «золотую милю» в Юрмале
- 30.12.2020 Накануне 25-летия Балтийский курс/The Baltic Course уходит с рынка деловых СМИ
- 30.12.2020 On the verge of its 25th anniversary, The Baltic Course leaves business media market
- 30.12.2020 Business Education Plus предлагает анонсы бизнес-обучений в январе-феврале 2021 года
- 30.12.2020 Hotels showing strong interest in providing self-isolation service
- 30.12.2020 EU to buy additional 100 mln doses of coronavirus vaccine
- 30.12.2020 ЕС закупит 100 млн. дополнительных доз вакцины Biontech и Pfizer
- 29.12.2020 В Rietumu и в этот раз создали особые праздничные открытки и календари 2021


 «The Baltic Course» Is Sold and Stays in Business!
