
Analytics, Investments, Lithuania
International Internet Magazine. Baltic States news & analytics
Friday, 13.06.2025, 04:57
Lithuanian enterprises’ direct investment abroad made LTL 5.09 bln as of 1 October 2008
 Print version
Most of all – LTL 1.25 billion (24.6% of the total direct investment abroad) – was invested in Latvia, Russia – LTL 0.65 billion (12.7%), the Netherlands – LTL 0.49 billion (9.7%), Poland – LTL 0.46 billion (9.1%), Ukraine – LTL 0.39 billion (7.6%), Bulgaria – LTL 0.34 billion (6.6%), United Kingdom – LTL 0.33 billion (6.6%).
Lithuania’s direct investment in EU-27 countries made LTL 3.68 billion (72.2% of Lithuania’s investment abroad), in CIS countries – LTL 1.11 billion (21.7%).
As far as investment abroad is concerned, Lithuanian enterprises mostly invested in real estate, renting and other business enterprises – LTL 1.97 billion (38.6% of the total direct investment abroad), financial intermediation – LTL 1.08 billion (21.2%), manufacturing – LTL 0.78 billion (15.3%), wholesale and retail trade – LTL 0.59 billion (11.5%), transport, storage and communication – LTL 0.35 billion (6.9%).
Within manufacturing, the bulk of investment fell per manufacture of chemical products – LTL 0.35 billion (44.8% of the total direct investment in manufacturing abroad), food products, beverages and tobacco – LTL 0.19 billion (25.0%).
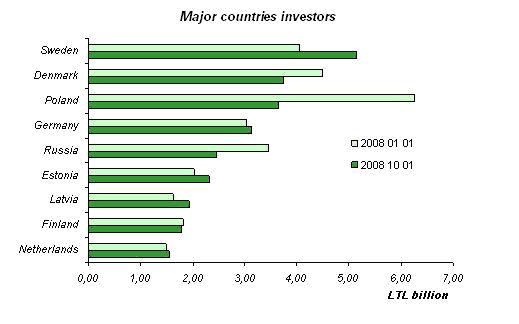
According to the data of 1 October 2008, foreign direct investment (FDI) in Lithuania made LTL 33.48 billion, or by 5.7% less than on 1 January 2008 (LTL 35.50 billion). The per capita FDI equalled, on average, LTL 10.0 thousand (on 1 January 2008 – LTL 10.5 thousand).
The bulk of investment fell per investors from Sweden – LTL 5.15 billion (15.4% of the total FDI), Denmark – LTL 3.75 billion (11.2%), Poland – LTL 3.65 billion (10.9%), Germany – LTL 3.13 billion (9.4%), Russia – LTL 2.44 billion (7.3%), Estonia – LTL 2.31 billion (6.9%), Latvia – LTL 1.93 billion (5.8%), Finland – LTL 1.78 billion (5.3%), the Netherlands – LTL 1.55 billion (4.6%).
Direct investment from EU-27 countries made LTL 27.09 billion (80.9%), from the CIS countries – LTL 2.59 billion (7.7% of the total FDI).
As of 1 October 2008, the bulk of investment fell per manufacturing – 28.9% (of which manufacture of oil and chemical products – 15.5%), financial intermediation – 16.4%, transport, storage and communication – 14.8%, wholesale and retail trade – 12.4%, real estate, rent and other business activities – 11.8%, electricity, gas and water supply – 7.5% of the total FDI.
Within manufacturing, the bulk of investment fell per oil products and manufacture of chemical products – LTL 5.19 billion (53.7% of the total investment in manufacturing), manufacture of food products, beverages and tobacco – LTL 1.50 billion (15.5%).
FDI by economic activity
|
|
1 January 2008 |
1 October 2008 | ||
|
LTL billion |
% |
LTL billion |
% | |
|
Total |
35.50 |
100 |
33.48 |
100 |
|
Agriculture, forestry, fishery |
0.19 |
0.6 |
0.25 |
0.8 |
|
Mining and quarrying |
0.19 |
0.5 |
0.19 |
0.5 |
|
Manufacturing |
12.59 |
35.5 |
9.66 |
28.9 |
|
Electricity, gas and water supply |
3.21 |
9.0 |
2.52 |
7.5 |
|
Construction |
0.55 |
1.5 |
0.66 |
2.0 |
|
Wholesale and retail trade; repairs of household appliances |
3.98 |
11.2 |
4.15 |
12.4 |
|
Hotels and restaurants |
0.26 |
0.7 |
0.30 |
0.9 |
|
Transport, storage and communications |
4.44 |
12.5 |
4.97 |
14.8 |
|
Financial intermediation |
5.94 |
16.7 |
5.50 |
16.4 |
|
Real estate, rent and other business activities |
2.90 |
8.2 |
3.96 |
11.8 |
|
Other business activities |
0.35 |
1.0 |
0.36 |
1.1 |
|
Acquisition of private real estate1 |
0.90 |
2.6 |
0.96 |
2.9 |
1 Data on acquisition of private real estate are included into FDI.


 «The Baltic Course» Is Sold and Stays in Business!