
Analytics, Baltic, Economics, GDP, Latvia, Markets and Companies
International Internet Magazine. Baltic States news & analytics
Saturday, 03.05.2025, 05:32
In Q3, GDP of Latvia grew by 4.5% y-o-y
 Print version
In the 3rd quarter of 2013, GDP at constant prices has increased by 4.5% (seasonally non-adjusted data), as compared to the 3rd quarter of 2012, while, in comparison with the 2ndquarter of 2013, it has grown by 1.3% (seasonally adjusted data). In comparison with nine months of 2013, GDP in nine months of 2013 has risen by 4.2% (seasonally non-adjusted data).
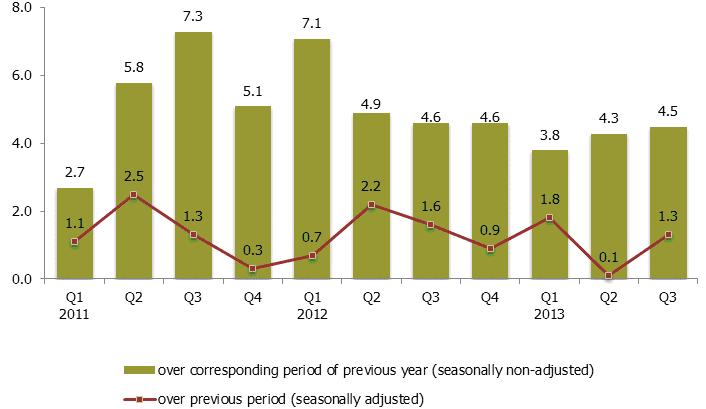 |
| Changes of GDP, Q1 2011–Q3 2013*(at constant prices, %) |
Data source: Central Statistical Bureau of Latvia
* Since September 30, CSB is publishing GDP data at constant prices, changing the reference year from 2000 to 2010. More detailed explanation on changes in the reference year is available at CSB website, see information published on September 30.
Production approach
Compared to the 3rd quarter of the previous year, notable upward pressure on GDP in the 3rd quarter of this year was applied by 5.4% rise in trade, of which by 3% rise in retail trade. Increase in retail trade was influenced by 3% growth in retail sale of food and by 4% increase in retail sale of non-food products, except automotive fuel. Retail sale of automotive fuel, share of which in the non-food commodity group accounts for 29%, has declined by 0.4%.
As compared to the 3rd quarter of the previous year, construction has gone up by 11.6%. Sector growth was affected by 83% rise in construction of residential buildings. Volume of civil engineering structures constructed has increased by 21%, since construction of bridges and tunnels has risen by 99%, while reconstruction of harbours – 2.3 times. 3% drop was recorded in construction of buildings, of which 51% reduction in construction of hospital and institutional care buildings and 13% decrease in construction of school, university and research buildings.
In the 3rd quarter of this year, manufacturing rate has grown by 2.5%; and that, in turn, facilitated rise in GDP rate by 0.3 percentage points. Rate changes were influenced also by 6% increase in manufacture of wood and of products of wood (20.5% of total manufacturing), 4% rise in manufacture of non-metallic mineral products (9.8% of total manufacturing), as well as 6% growth in manufacture of fabricated metal products (8.2% of total manufacturing). Manufacture of food products has gone up by 6% (19.6%), whereas manufacture of chemicals and chemical products has reduced by 10% (3.7% of total manufacturing), and manufacture of basic metals has decreased by 69% (1% of total manufacturing).
6.4% more taxes on products (Value Added Tax, Excise Duty, customs duties) were collected; and that left 0.7 percentage point influence on GDP growth rate.
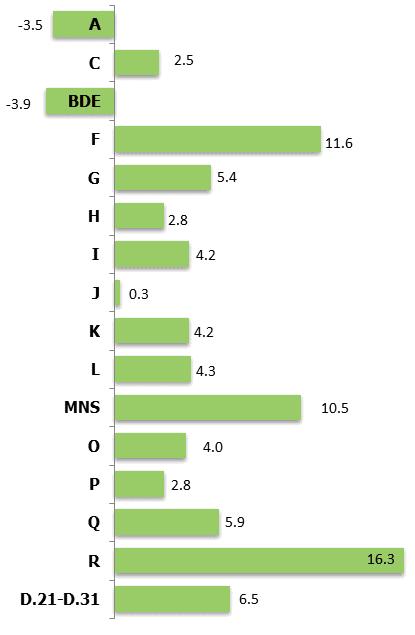 |
| Changes of GDP in the 3rd quarter of 2013 by main kind of economic activity (at constant prices, % over 3rd quarter of 2012) |
|
NACE Rev. 2 Sections |
|
|
agriculture, hunting and forestry (A); |
5.5 |
|
manufacturing (C); |
13.8 |
|
other industry (BDE); |
3.6 |
|
construction (F); |
8.5 |
|
trade (G); |
16.9 |
|
transportation and storage (H); |
11.3 |
|
accommodation and food service activities (I); |
2.3 |
|
information and communication (J); |
3.9 |
|
financial and insurance activities (K); |
3.8 |
|
real estate activities (L); |
9.1 |
|
commercial services (MNS); |
7.8 |
|
public administration and defence; compulsory social security (O); |
5.9 |
|
education (P); |
3.2 |
|
human health and social work activities (Q); |
2.5 |
|
arts, entertainment and recreation (R); |
1.9 |
|
Taxes on products minus subsidies on products (D.21-D.31); |
x |
Expenditure approach
In comparison with the 3rd quarter of 2012, private final consumption at current prices in the 3rd quarter of 2013 has grown by 5.0%. Rise was observed within the main groups of final consumption expenditure: housing maintenance (22% of total expenditure) – of 1.3%, food (19% of total expenditure) – of 4.7%, and transport (16% of total expenditure) – of 3.8%. Due to the increase in construction production, gross fixed capital formation has increased by 4.4%. Export of goods (71% of total exports) has declined by 4.1%, while export of services has increased by 6.4%. Import of goods (84% of total imports) has dropped by 0.7%, whereas import of services – by 4.8%. Government final consumption, in turn, has risen by 9.9%.
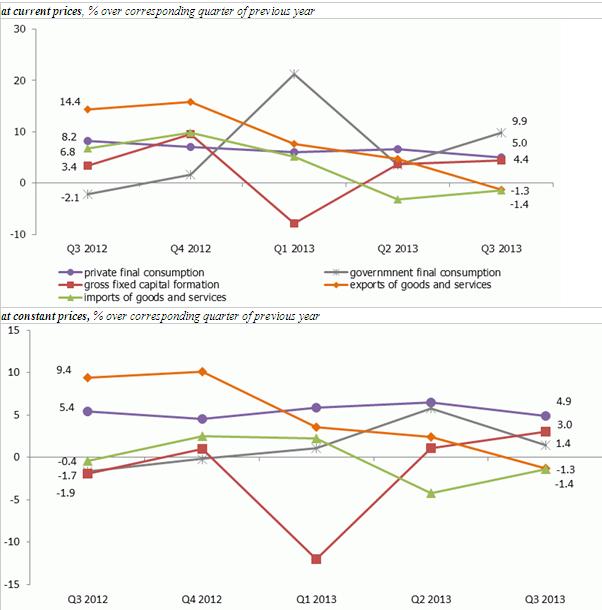 |
| Gross Domestic Product by main expenditure item |
Data source: Central Statistical Bureau of Latvia
In comparison with the 3rd quarter of 2012, private final consumption in the 3rd quarter of 2013at constant prices has grown by 4.9%, of which expenditure on housing has reduced by 4%, while expenditure on food and expenditure on transport have increased by 2% and 7%, respectively. Increase of the private final consumption had a positive effect on the total GDP rate – of 3.1 percentage points.
Expenditure on gross fixed capital formation has gone up by 3%; and that had a positive effect on the GDP – of 0.8 percentage points. Government final consumption has grown by 1.4%, thus increasing total GDP rate by 0.2 percentage points. Export of goods has decreased by 4.5%, whereas export of services has increased by 7.5%. Export of both has reduced GDP by 0.8 percentage points. Furthermore, import of goods has declined by 0.1%, while import of services – by 8.1%. Imports reduction had a positive impact on the GDP – of 0.9 percentage points.
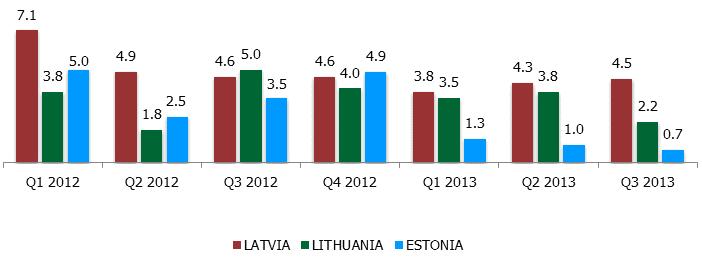 |
| Changes of Gross Domestic Product in the Baltic States (at constant prices, % over corresponding period of previous year) |
Data source: Central Statistical Bureau of Latvia, Statistics Lithuania, Statistics Estonia


 «The Baltic Course» Is Sold and Stays in Business!
