Analytics, Lithuania
International Internet Magazine. Baltic States news & analytics
Wednesday, 21.05.2025, 05:31
Refined petroleum products in Lithania in March went up in price 5%
 Print version
 |
|---|
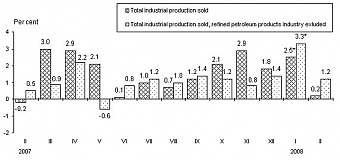
| The diagram presents monthly price changes of the industrial production sold – total and excluding refined petroleum products. |
Refined petroleum products excluded, prices for the total industrial production sold grew by 0.8%.
In March 2008 against February, the general price change was mostly influenced by a 5.0% price rise for refined petroleum products, 7.9% – chemicals and chemical products, 11.3% – base metals, as well as by a 2.4% price drop for rubber and plastic products, 1.6% – wood and wood products, 0.9% – furniture.
Prices for products sold on the domestic market over a month increased by 1.1%. It was mostly influenced by a 5.2% price growth for refined petroleum products, 1.5% – food products and beverages, 2.8% – chemicals and chemical products, as well as by a 1.5% price drop for rubber and plastic products, 0.9% – non-metal mineral products, 0.8% – publishing, printing and reproduction of recorded media. Among food products and beverages, the most noticeable price growth was recorded for animal feeding stuff – 4.9%, bread and fresh confectionery – 3.8%, mineral water and soft drinks – 2.0%, meat – 1.1%; milk and milk products (excluding ice-cream) went down in price by 2.8%, fish and fish products – 0.1%. In the electricity, gas, steam and hot water supply group, gas went up in price by 0.8%. Refined petroleum products industry excluded, prices for products sold on the domestic market increased by 0.5%.
Prices for exported products in March 2008 against February increased by 2.6%. It was mostly influenced by a 5.0% price rise for refined petroleum products, 9.5% – chemicals and chemical products, 18.2% – base metals, as well as by a 2.5% price drop for food products and beverages, 2.8% – wood and wood products, 3.5% – rubber and plastic products. Refined petroleum products industry excluded, prices for exported products increased by 1.3%.
Changes in prices for industrial production sold March 2008, %
|
|
Specific weight, compared with total industrial production |
March 2008 compared to | ||
|
February 2008 |
2007 | |||
|
December |
March | |||
|
Production of total industry |
100.0 |
1.9 |
4.6 |
21.0 |
|
Mining and quarrying |
1.3 |
-0.2 |
8.2 |
27.1 |
|
Manufacturing |
86.0 |
2.2 |
3.7 |
21.6 |
|
Manufacture of refined petroleum products |
26.2 |
5.0 |
2.3 |
36.0 |
|
Electricity, gas and water supply |
12.7 |
0.2 |
10.5 |
17.4 |
|
Production of total industry, manufacture of refined petroleum products excluded |
73.8 |
0.8 |
5.4 |
15.7 |
|
Production of manufacturing industry, manufacture of refined petroleum products excluded |
59.8 |
1.0 |
4.3 |
15.2 |
|
Industrial production sold on the domestic market |
100.0 |
1.1 |
5.3 |
17.6 |
|
Mining and quarrying |
1.3 |
0.0 |
12.4 |
22.2 |
|
Manufacturing |
73.3 |
1.4 |
3.5 |
17.9 |
|
Manufacture of refined petroleum products |
13.8 |
5.2 |
2.6 |
46.8 |
|
Electricity, gas and water supply |
25.4 |
0.2 |
10.1 |
17.2 |
|
Total industrial production sold on the domestic market, manufacture of refined petroleum products excluded |
86.2 |
0.5 |
5.7 |
13.8 |
|
Production of manufacturing industry, manufacture of refined petroleum products excluded |
59.5 |
0.6 |
3.7 |
12.3 |
|
Exported industrial production |
100.0 |
2.6 |
3.9 |
24.1 |
|
Mining and quarrying |
1.2 |
-0.5 |
3.6 |
31.9 |
|
Manufacturing |
98.4 |
2.7 |
3.8 |
24.1 |
|
Manufacture of refined petroleum products |
38.2 |
5.0 |
2.2 |
33.0 |
|
Electricity, gas and water supply |
0.4 |
0.0 |
36.9 |
36.9 |
|
Exported industrial production, manufacture of refined petroleum products excluded |
61.8 |
1.3 |
5.0 |
18.3 |
|
Production of manufacturing industry, manufacture of refined petroleum products excluded |
60.2 |
1.3 |
4.8 |
18.0 |


 «The Baltic Course» Is Sold and Stays in Business!

