
Analytics, Economics, Lithuania
International Internet Magazine. Baltic States news & analytics
Tuesday, 26.08.2025, 20:34
Volumes of GDP per capita increased in all counties of Lithuania in 2007
 Print version
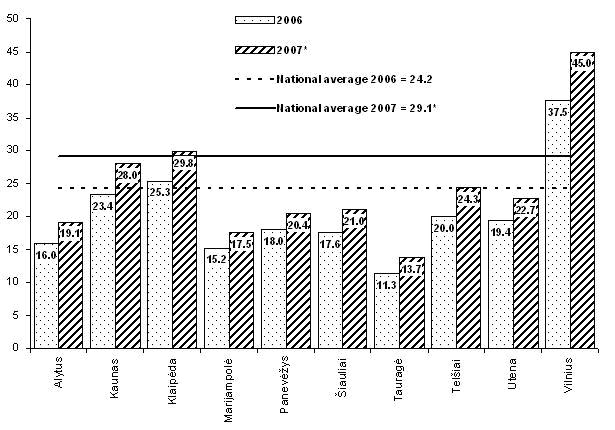
As in the previous year, the bulk of GDP per capita, against the country’s average, fell per Vilnius (154.9%) and Klaipėda (102.6%) counties. Vilnius county is the most important region of the country. Nominal GDP per capita in 2007 in Vilnius county grew by 20% (in the country – by 20.2%). Economic results of Vilnius county depend a lot on the industrial and non-industrial service sector. As many as 71% of the county’s value added fall per services (nationally – 63%), while per industry – just 27.6% (nationally – 32.8%). Klaipėda county is one of the most successfully developing regions of the country. Nominal GDP per capita in 2007 in Klaipėda county grew by 17.8%. As compared to Vilnius county, industry in Klaipėda county is more developed. In Klaipėda county, 32.7% of the county’s value added fall per industry.
In 2007, the most inconsiderable increase (by 13.3%) in nominal GDP per capita was recorded in Panevėžys county. In six counties (Alytus, Marijampolė, Panevėžys, Šiauliai, Tauragė and Utena), the share of GDP per capita still does not exceed 80% of the national average.
The results demonstrate that the gap between Vilnius and other regions did not narrow in 2007 but became even wider. The per capita GDP in Vilnius county, was two and more times higher than that in Alytus, Marijampolė, Panevėžys, Šiauliai, Tauragė and Utena counties.
Due to the revision of national accounts indicators in 2000–2007 (considering new sources of information and implementation of methodological changes), Statistics Lithuania revised GDP by counties according to the data of 2000–2006.
GDP by counties, 2007*
|
|
Lithuanian |
GDP by counties | |||||||||
|
Alytus |
Kaunas |
Klaipėda |
Marijampolė |
Panevėžys |
Šiauliai |
Tauragė |
Telšiai |
Utena |
Vilnius | ||
|
GDP, LTL billion |
98.1 |
3.4 |
18.9 |
11.3 |
3.2 |
5.8 |
7.4 |
1.7 |
4.2 |
3.9 |
38.2 |
|
GDP structure,% |
100.0 |
3.5 |
19.3 |
11.5 |
3.2 |
5.9 |
7.5 |
1.8 |
4.3 |
4.0 |
38.9 |
|
GDP per capita, LTL thousand |
29.1 |
19.1 |
28.0 |
29.8 |
17.5 |
20.4 |
21.0 |
13.7 |
24.3 |
22.7 |
45.0 |
|
Against national average,% |
100.0 |
65.5 |
96.3 |
102.6 |
60.3 |
70.3 |
72.3 |
47.0 |
83.5 |
78.1 |
154.9 |
|
Employed persons, thousand |
1528.8 |
71.7 |
311.7 |
168.4 |
81.3 |
118.4 |
147.5 |
51.5 |
77.6 |
81.3 |
419.4 |
|
Population, thousand |
3375.6 |
178.0 |
675.5 |
379.2 |
181.9 |
285.7 |
351.8 |
128.0 |
174.0 |
173.7 |
847.9 |
* Provisional data.
 |
| Per capita GDP by counties |
* Provisional data.


 «The Baltic Course» Is Sold and Stays in Business!
