
Analytics, Economics, GDP, Lithuania
International Internet Magazine. Baltic States news & analytics
Tuesday, 26.08.2025, 20:34
Nominal GDP per capita in Lithuanian economy dropped by 17.5% in 2009
 Print version
Similarly to the previous year, in terms of GDP per capita, compared to the national average, Vilnius (153%) and Klaipėda (108%) counties remained in the lead. Nominal GDP per capita in Vilnius county dropped by 18.5%, in Klaipėda county – by 11.6%, and it was the smallest drop in nominal GDP per capita among counties.
In six counties (Alytus, Marijampolė, Panevėžys, Šiauliai, Tauragė, and Telšiai), GDP per capita did not exceed 80% of the national average. In 2008, there were five such counties.
In 2009, the gap between Vilnius and other regions did not narrow. GDP per capita in Vilnius county was twice as large as those of Alytus, Marijampolė, Panevėžys, Šiauliai, and Tauragė counties.
Gross domestic product by county, 2009*
|
|
National
|
Counties | |||||||||
|
Alytus |
Kaunas |
Klaipėda |
Marijampolė |
Panevėžys |
Šiauliai |
Tauragė |
Telšiai |
Utena |
Vilnius | ||
|
Gross domestic product, LTL billion |
91.5 |
3.1 |
17.4 |
11.2 |
3.0 |
5.4 |
6.6 |
1.7 |
3.7 |
3.9 |
35.6 |
|
Structure of gross domestic product, % |
100.0 |
3.3 |
19.0 |
12.2 |
3.3 |
5.9 |
7.3 |
1.8 |
4.0 |
4.2 |
38.9 |
|
Gross domestic product per capita, LTL thous.* |
27.4 |
17.5 |
26.0 |
29.6 |
16.9 |
19.3 |
19.3 |
13.5 |
21.4 |
22.8 |
41.9 |
|
Gross domestic product per capita, compared to the national average, % |
100.0 |
63.9 |
94.8 |
108.0 |
61.7 |
70.4 |
70.4 |
49.1 |
78.0 |
83.2 |
153.0 |
|
Employment, |
1415.1 |
72.1 |
281.9 |
159.5 |
71.7 |
111.2 |
142.3 |
47.4 |
64.2 |
76.1 |
388.7 |
|
Population, thous. |
3339.5 |
174.3 |
668.4 |
377.4 |
179.1 |
279.8 |
343.9 |
125.4 |
171.8 |
169.2 |
850.1 |
* Provisional data
** Based on ESA 95
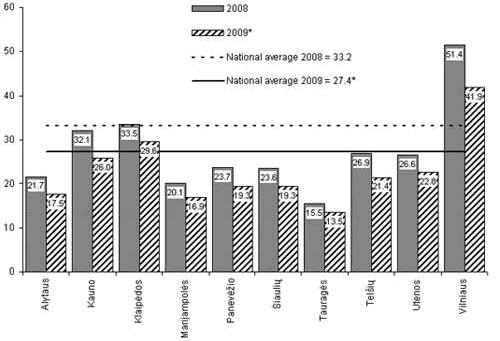 |
| Gross domestic product per capita by county, LTL thousand |
* Provisional data


 «The Baltic Course» Is Sold and Stays in Business!
