
Analytics, Industry, Latvia, Markets and Companies
International Internet Magazine. Baltic States news & analytics
Friday, 19.06.2026, 10:44
Producer prices in Latvian industry increased by 7.1% in September y-o-y
 Print version
Rise of prices was characteristic both for goods sold on the domestic market (by 0.1%) and for exported goods where prices increased by 1.0%. Major price increases were in the manufacture of food products (by 2.3%), in the manufacture of basic metals (by 5.5%), in waste collection, treatment and disposal activities; materials recovery (by 12.4%), in the manufacture of wood and of products of wood, except furniture (by 1.0%), in the manufacture of other non-metallic mineral products (by 1.6%). However, the changes of the prices of electricity, gas, steam and air conditioning supply left the biggest downward impact on the overall level of producer prices (decrease by 1.9%).
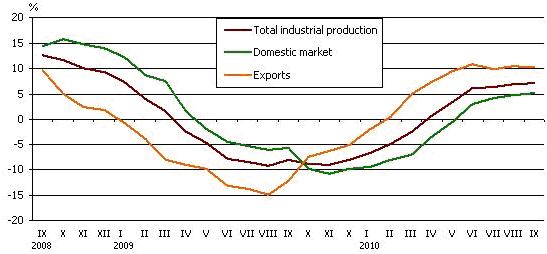 |
| Producer price changes over the corresponding month of the previous year |
Over a year (compared to September 2009) producer prices in industry increased by 7.1%. The rise in prices of products sold on the domestic market was 5.1%, but prices of exported products rose by 10.2%. The changes of the prices in the manufacture of wood and of products of wood, except furniture (growth of 16.0%), in electricity, gas, steam and air conditioning supply (of 6.7%), in the manufacture of basic metals (of 33.2%), in the manufacture of food products (of 5.1%) had the biggest upward impact on the overall level of producer prices.
Producer price changes in September 2010
|
|
Weights (%) |
Price changes (%) in September 2010 compared to | ||
|
August 2010 |
September 2009 | |||
|
Total industrial production |
100.0 |
0.5 |
7.1 | |
|
|
Mining and quarrying |
1.8 |
0.0 |
-0.9 |
|
|
Manufacturing |
74.8 |
1.0 |
6.7 |
|
|
Electricity. gas. steam and air conditioning supply |
21.6 |
-1.9 |
6.7 |
|
|
Water supply. sewerage. waste management and remediation activities |
1.8 |
9.5 |
27.5 |
|
Products sold on the domestic market |
100.0 |
0.1 |
5.1 | |
|
|
Mining and quarrying |
1.3 |
0.0 |
-7.4 |
|
|
Manufacturing |
61.2 |
1.3 |
3.2 |
|
|
Electricity. gas. steam and air conditioning supply |
35.4 |
-1.9 |
6.4 |
|
|
Water supply. sewerage. waste management and remediation activities |
2.1 |
4.4 |
29.9 |
|
Exported products |
100.0 |
1.0 |
10.2 | |
|
|
of which: |
|
|
|
|
|
mining and quarrying |
2.6 |
0.0 |
4.2 |
|
|
manufacturing |
95.5 |
0.8 |
10.1 |
Producer price changes in the 3rd quarter of 2010
|
|
Price changes (%) in the 3rd quarter of 2010 compared to | ||
|
2nd quarter of 2010 |
3rd quarter of 2009 | ||
|
Total industrial production |
1.8 |
6.8 | |
|
|
Mining and quarrying |
0.8 |
-1.2 |
|
|
Manufacturing |
1.5 |
5.9 |
|
|
Electricity. gas. steam and air conditioning supply |
3.3 |
7.8 |
|
|
Water supply. sewerage. waste management and remediation activities |
-4.8 |
25.4 |
|
Products sold on the domestic market |
2.2 |
4.6 | |
|
|
Mining and quarrying |
-0.3 |
-8.8 |
|
|
Manufacturing |
1.6 |
1.8 |
|
|
Electricity. gas. steam and air conditioning supply |
3.3 |
7.6 |
|
|
Water supply. sewerage. waste management and remediation activities |
1.2 |
28.5 |
|
Exported products |
1.1 |
10.1 | |
|
|
of which: |
|
|
|
|
mining and quarrying |
1.5 |
4.9 |
|
|
manufacturing |
1.5 |
10.0 |
Since the corrections of data for the previous month were submitted by respondents, producer price index for August 2010 was recalculated. More detailed information can be found in the CSB data base.


 «The Baltic Course» Is Sold and Stays in Business!
