
Analytics, Financial Services, Investments, Lithuania
International Internet Magazine. Baltic States news & analytics
Friday, 13.06.2025, 02:45
Foreign direct investment in Lithuania as of July 2009 increased by 3.3%
 Print version
The largest investment was made by Swedish – LTL 4.94 billion (14.8% of total FDI), Polish – LTL 3.67 billion (11%), German – LTL 3.25 billion (9.8%), Danish – LTL 3.03 billion (9.1%), Estonian – LTL 2.37 billion (7.1%), and Dutch – LTL 2.03 billion (6.1%) investors.
Direct investment from EU-27 countries amounted to LTL 27.02 billion (81.1% of total FDI), from CIS countries – LTL 1.92 billion (5.8%).
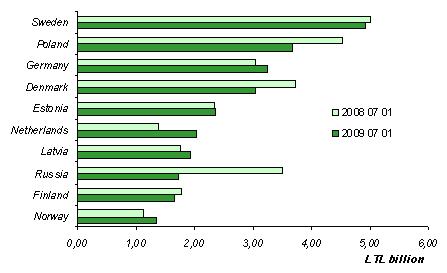 |
| Major investing countries |
As of 1 July 2009, the largest investment was made in manufacturing – 27.2%, real estate, renting and business activities – 15.4%, financial intermediation – 15.1%, transport, storage and communication – 14.2%, wholesale and retail trade – 13.2% of total FDI. In II quarter 2009, the hugest (largest) increase was observed for direct investment in manufacturing.
In manufacturing, the largest investment was made in the manufacture of petroleum and chemical products – LTL 4.76 billion (52.4% of total investment in manufacturing), food products, beverages and tobacco – LTL 1.59 billion (17.6%).
FDI by economic activity
|
|
1 January 2009 |
1 April 2009 |
1 July 2009 | |||||
|
LTL billion |
% |
LTL billion |
% |
LTL billion |
% |
against 1 January 2009,% |
against 1 April 2009,% | |
|
Total |
31.59 |
100 |
32.27 |
100 |
33.33 |
100 |
5.5 |
3.3 |
|
Agriculture, forestry, fishery |
0.27 |
0.9 |
0.26 |
0.8 |
0.28 |
0.8 |
3.7 |
6.3 |
|
Mining and quarrying |
0.19 |
0.6 |
0.12 |
0.4 |
0.12 |
0.4 |
-37.4 |
1.5 |
|
Manufacturing |
7.32 |
23.2 |
7.45 |
23.1 |
9.08 |
27.2 |
23.9 |
21.9 |
|
Electricity, gas and water supply |
2.35 |
7.4 |
2.33 |
7.2 |
2.19 |
6.6 |
-7.1 |
-6.0 |
|
Construction |
0.63 |
2.0 |
0.63 |
1.9 |
0.65 |
1.9 |
2.7 |
3.7 |
|
Wholesale and retail trade; repair of personal and household goods |
4.45 |
14.1 |
4.42 |
13.7 |
4.39 |
13.2 |
-1.4 |
-0.8 |
|
Hotels and restaurants |
0.31 |
1.0 |
0.27 |
0.9 |
0.23 |
0.7 |
-23.8 |
-14.7 |
|
Transport, storage and communication |
4.54 |
14.4 |
4.73 |
14.6 |
4.74 |
14.2 |
4.3 |
0.2 |
|
Financial intermediation |
4.93 |
15.6 |
5.29 |
16.4 |
5.03 |
15.1 |
2.1 |
-4.9 |
|
Real estate, renting and business activities |
5.14 |
16.3 |
5.30 |
16.4 |
5.12 |
15.4 |
-0.3 |
-3.4 |
|
Other business activities |
0.39 |
1.2 |
0.39 |
1.2 |
0.39 |
1.2 |
-1.3 |
0.0 |
|
Purchase and sale of real estate |
1.07 |
3.3 |
1.08 |
3.4 |
1.11 |
3.3 |
4.3 |
2.6 |
As of 1 July 2009, direct investment of Lithuanian enterprises abroad amounted to LTL 5.53 billion, which is by 6.3% more than as of 1 April 2009 (LTL 5.20 billion).
The largest direct investment of Lithuanian enterprises – LTL 1.04 billion (18.8% of total direct investment abroad) – was made in the Netherlands, while direct investment in Latvia amounted to LTL 0.98 billion (17.7%), Russia – LTL 0.63 billion (11.4%), Bulgaria – LTL 0.51 billion (9.2%), Poland – LTL 0.48 billion (8.7%), Ukraine – LTL 0.37 billion (6.7%).
Direct investment of Lithuanian enterprises in EU-27 countries amounted to LTL 4.17 billion (75.4% of total direct investment abroad), in CIS countries – LTL 1.09 billion (19.7%).
The largest direct investment of Lithuanian enterprises abroad was made in real estate, renting and business activities – LTL 2.09 billion (37.8% of total direct investment abroad), while direct investment in financial intermediation amounted to LTL 1.02 billion (18.5%), wholesale and retail trade – LTL 0.91 billion (16.5%), manufacturing – LTL 0.71 billion (12.9%). In manufacturing, the largest investment was made in the manufacture of chemical products – 43.6% of total direct investment in manufacturing abroad, food products, beverages and tobacco – 24.3%.


 «The Baltic Course» Is Sold and Stays in Business!
