
Analytics, Investments, Lithuania
International Internet Magazine. Baltic States news & analytics
Wednesday, 18.06.2025, 06:27
Foreign direct investment in Lithuania decreased by 6.9 % in April y-o-y
 Print version
The decrease in FDI was conditioned by a decrease in share capital and reinvestment. As of 1 April 2009, the share capital and reinvestment made LTL 23.28 billion, i.e. by 19.6% less than as of 1 April 2008 (LTL 28.97 billion).
The largest investment was made by Swedish – LTL 5.28 billion (16.3% of total FDI), German – LTL 3.17 billion (9.8%), Danish – LTL 3.03 billion (9.4%), Estonia – LTL 2.41 billion (7.5%), Dutch – LTL 2.04 billion (6.3%) and Latvian – LTL 2.02 billion (6.3%) investors.
Direct investment from EU-27 countries made LTL 26.08 billion (80.7% of total FDI), from CIS countries – LTL 1.96 billion (6.1%).
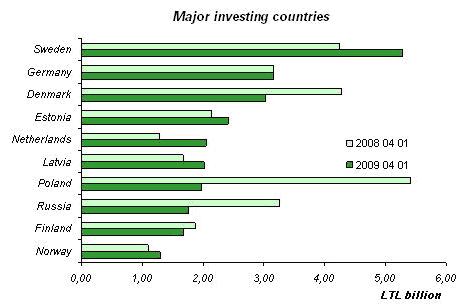
The decrease in direct investment from Denmark and Russia conditioned a decrease in FDI in manufacturing, electricity, gas and water supply and financial intermediation enterprises. Direct investment from Poland decreased after the share capital of the joint-stock company Mažeikių nafta was recalculated from the market to nominal price.
As of 1 April 2009, the largest investment was made in manufacturing – 23.1%, real estate, renting and business activities – 16.5%, financial intermediation – 16.4%, transport, storage and communications – 14.6%, wholesale and retail trade – 13.7%, electricity, gas and water supply – 7.2% of total FDI. Over a year, the most considerable increase was observed for FDI in real estate, renting and business activities, agriculture, forestry, fishery, hotels and restaurants.
In manufacturing, the largest investment was made in the manufacture of petroleum and chemical products – LTL 3.15 billion (42.2% of total investment in manufacturing), food products, beverages and tobacco – LTL 1.58 billion (21.2%).
FDI by kind of economic activity
|
|
1 April 2008 |
1 January 2009 |
1 April 2009 | |||||
|
LTL billion |
% |
LTL billion |
% |
LTL billion |
% |
Against 1 January 2009,% |
Against 1 April 2008,% | |
|
Total |
34.71 |
100 |
31.48 |
100 |
32.31 |
100 |
2.6 |
-6.9 |
|
Agriculture, forestry, fishery |
0.24 |
0.7 |
0.27 |
0.9 |
0.26 |
0.8 |
-2.4 |
11.5 |
|
Mining and quarrying |
0.19 |
0.5 |
0.19 |
0.6 |
0.12 |
0.4 |
-38.3 |
-38.4 |
|
Manufacturing |
11.84 |
34.1 |
7.32 |
23.3 |
7.45 |
23.1 |
1.7 |
-37.0 |
|
Electricity, gas and water supply |
3.06 |
8.8 |
2.35 |
7.5 |
2.33 |
7.2 |
-1.1 |
-24.0 |
|
Construction |
0.56 |
1.6 |
0.63 |
2.0 |
0.63 |
1.9 |
-0.9 |
12.7 |
|
Wholesale and retail trade; repair of personal and household goods |
4.06 |
11.7 |
4.45 |
14.1 |
4.44 |
13.7 |
-0.3 |
9.3 |
|
Hotels and restaurants |
0.25 |
0.7 |
0.31 |
1.0 |
0.27 |
0.9 |
-10.8 |
9.7 |
|
Transport, storage and communications |
4.55 |
13.1 |
4.54 |
14.4 |
4.73 |
14.6 |
4.1 |
4.0 |
|
Financial intermediation |
5.68 |
16.4 |
4.93 |
15.6 |
5.29 |
16.4 |
7.4 |
-6.9 |
|
Real estate, renting and business activities |
2.99 |
8.6 |
5.14 |
16.3 |
5.35 |
16.5 |
4.1 |
78.6 |
|
Other business activities |
0.37 |
1.1 |
0.39 |
1.2 |
0.39 |
1.2 |
-1.3 |
4.0 |
As of 1 April 2009, direct investment of Lithuanian enterprises abroad made LTL 5.16 billion, or by 19.8% more than as of 1 April 2008 (LTL 4.31 billion). The largest direct investment of Lithuanian enterprises – LTL 1.13 billion (21.9% of total direct investment abroad) – was made in Latvia, while in the Netherlands – LTL 0.73 billion (14.2%), Russia – LTL 0.63 billion (12.2%), Poland – LTL 0.44 billion (8.6%), Ukraine – LTL 0.38 billion (7.4%), Bulgaria – LTL 0.36 billion (6.9%).
Direct investment of Lithuanian enterprises in EU-27 countries made LTL 3.78 billion (73.4% of total direct investment abroad), in CIS countries – LTL 1.08 billion (21.0%).
The largest direct investment of Lithuanian enterprises abroad was made in real estate, renting and business activities – LTL 1.98 billion (38.3% of total direct investment abroad), financial intermediation – LTL 1.05 billion (20.3%), wholesale and retail trade – LTL 0.79 billion (15.2%), manufacturing – LTL 0.71 billion (13.8%), transport, storage and communications – LTL 0.31 billion (6.0%) enterprises. In manufacturing, the largest investment was made in the manufacture of chemical products – 45.0% of total direct investment in manufacturing abroad, food products, beverages and tobacco – 24.6%.


 «The Baltic Course» Is Sold and Stays in Business!
