
Analytics, Demography, Latvia, Society, Statistics
International Internet Magazine. Baltic States news & analytics
Saturday, 02.05.2026, 16:47
Lower birth and migration rates recorded in Latvia
 Print version
From 2008 to 2016, the number of emigrants was prevailing over that of immigrants, while as emigration reduced the negative natural increase recorded in the past two years exceeded the negative migration flow difference. Over the last three years, the total population of the country has been reducing slower – the decline registered last year accounted for 0.74%, compared to 0.96% in 2016.
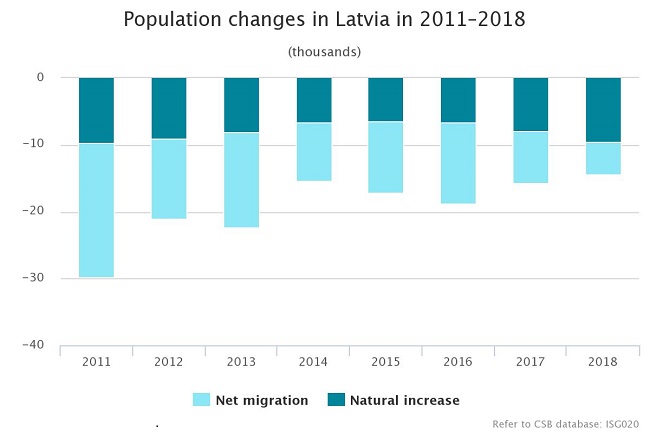
Last year, 19.3 thousand children were born (1 514 children fewer than in 2017), whereas 28.8 thousand people passed away (63 more than the year before). The negative natural increase constituting 9.5 thousand people is the highest one recorded over the past seven years.
In 2018, 10.9 thousand people arrived in Latvia from other countries (one thousand more than in 2017) and 15.8 thousand people left the country (1.9 thousand more than in 2017).
Out of the immigrants, 4.5 thousand people or 41 % came from the European Union (EU) countries. Citizens and non-citizens of Latvia as well as people having other citizenship but born in Latvia accounted for 4.9 thousand people or 44% of all immigrants. People not legally related to Latvia formed the rest part of the immigrants.
Out of the emigrants, 13.2 people emigrated to the EU countries, and United Kingdom and Germany were the most popular destinations. Citizens of Latvia constituted 82% of the emigrants.
Demography
trends in Latvia; 2016–2018
|
|
2016 |
2017 |
2018 |
2017, as % compared to 2016 |
2018, as % compared to 2017 |
per 1 000 inhabitants |
|
|
2017 |
2018 |
||||||
|
Population,
at the end of the year |
1 950 116 |
1 934 379 |
1 919 968 |
-0.8 |
-0.7 |
x |
x |
|
Births |
21 968 |
20 828 |
19 314 |
-5.2 |
-7.3 |
10.7 |
10.0 |
|
Deaths |
28 580 |
28 757 |
28 820 |
+0.6 |
+0.2 |
14.8 |
15.0 |
|
Immigration |
8 345 |
9 916 |
10 909 |
+18.8 |
+10.0 |
5.0 |
5.7 |
|
Emigration |
20 574 |
17 724 |
15 814 |
-13.9 |
-10.8 |
9.1 |
8.2 |
Pierīga population is growing
Regional breakdown of the population shows that in 2018 population increase was recorded only in Pierīga (of 0.9% or 3.3 thousand people). The most notable population decline, in turn, was observed in Latgale region (of 1.7% or 4.6 thousand people). More detailed statistics for population change and ethnicities in regions and municipalities will be published on 7 June.
(as %)
Population ageing still observed
The slight birth increase in 2013–2016 facilitated rise in the number of children and young people, however in 2018 the number of children aged 0–14 fell, as the number of births was 1.5 thousand smaller than in 2017. The share of children and young people in the total population accounts for 15.9%. Population at working age kept declining (by 16.5 thousand people or 1.4%) and population over working age kept growing (by 2.3 thousand in 2018). The share of people at working age in the total population rose from 22.5 % at the beginning of 2018 to 22.8% at the beginning of 20191.
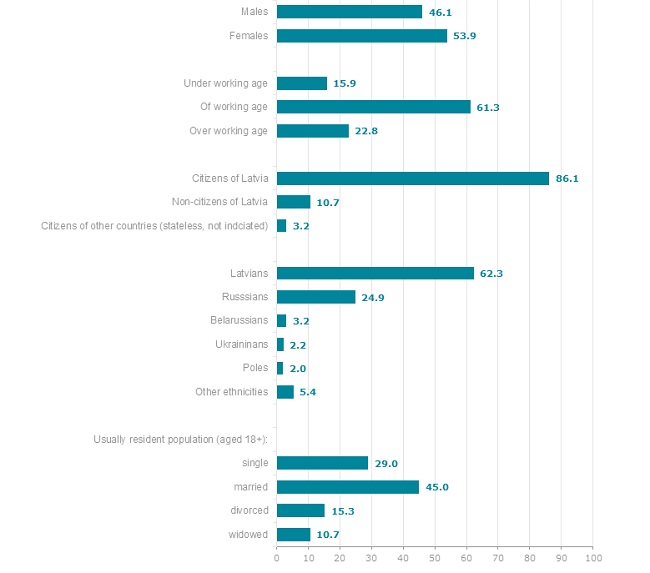
In 2018, population decline was recorded among all largest ethnicities in Latvia: number of Poles fell by 2.2%, of Lithuanians by 2.1%, of Belarussians by 2%, and of Russians by 1.8%. The number of Latvians dropped by 0.5%, however their share in the total population, regardless the total population decline, grew by 0.1 percentage points, constituting 62.3% at the beginning of 2019.
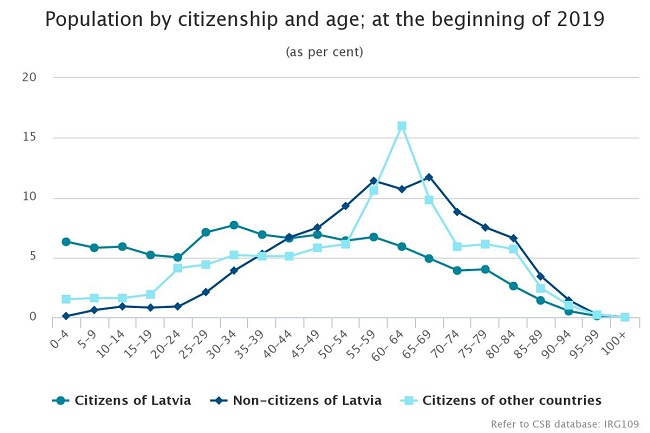
In respect to the citizenship, 86.1% were citizens of Latvia (85.9% at the beginning of 2018), 10.7% were non-citizens of Latvia (11.1%) and 2.2 % were citizens of Russia (2.2%). Majority of the non-citizens of Latvia (51%) lived in Riga, constituting 17% of the total Riga population. Out of all non-citizens of Latvia, 71% were aged 50 and over; the share of people having citizenship of other countries and belonging to this age group accounted for 64% and that of Latvians only for 37%.
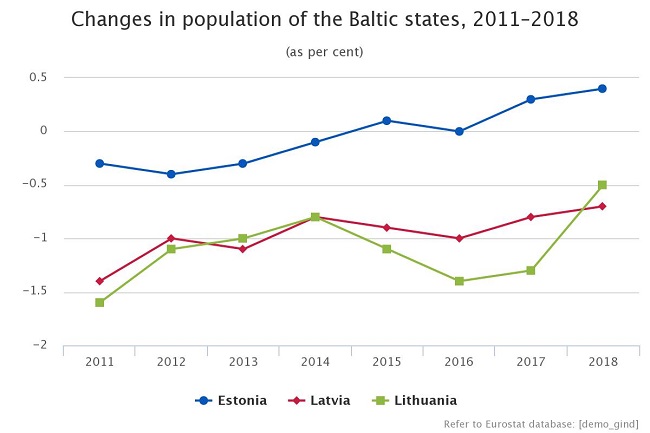
For comparison, here is some vital statistics for the Baltic states: at the beginning of 2019 population of Estonia accounted for 1 million 324.8 thousand people (rise of 5.7 thousand, compared to 2018). Natural increase in Estonia was negative as well – 1.4 thousand (14.4 thousand people were born and 15.8 thousand people died in 2018), while international long-term net migration was positive – 7.1 thousand (17.6 thousand people immigrated and 10.5 thousand emigrated). Provisional population of Lithuania, in turn, accounted for 2 million 794 thousand at the beginning of 2019 (population decline of 14.9 thousand people). Natural increase in Lithuania was negative as well – 11.6 thousand (28 thousand births and 40 thousand deaths in 2018) as was the net migration – 3.3 thousand3.
Annual population estimate was drawn up based on the data of the Population Register of the Office of Citizenship and Migration Affairs and other administrative data sources. In a few years – in May 2021 – the same method will be used to conduct Population and Housing Census, and population will not be surveyed. Therefore, the statistics for annual usually resident population of the country at the beginning of 2021 will be used as the results of the Census 2021.
Census 2021, being the most extensive and oldest population survey, hereinafter will be fully based on administrative data. Such an approach will be a big step towards producing statistics meeting the latest requirements in the field and will allow Latvia to join the group of well-developed Northern countries using the same method. CSB has already developed and tested largest part of the methodology used to produce high quality indicators. The method allows saving resources, moreover response burden on the country inhabitants is eliminated.


 «The Baltic Course» Is Sold and Stays in Business!
