
Analytics, Foreign trade , Latvia, Statistics
International Internet Magazine. Baltic States news & analytics
Saturday, 20.04.2024, 15:46
In July foreign trade turnover of Latvia was 0.9% larger than a year ago
 Print version
Over the
first seven months of this year, the foreign trade turnover of Latvia at
current prices reached EUR 16.25 bn – EUR 356.7 mln or 2.2%
more than in the corresponding period of 2018. The exports value constituted
EUR 7.22 bn (an increase of EUR 47.3 mln or 0.7 %), whereas
the imports value – EUR 9.03 bn (an upturn of EUR 309.4 mln
or 3.5%).
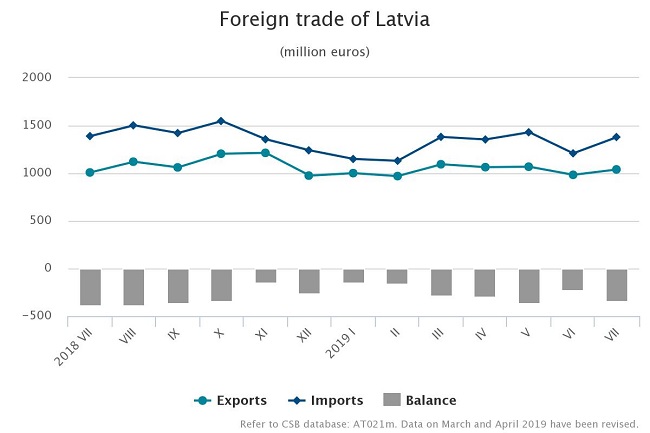
Calendar
and seasonally adjusted data show that, compared to July 2018, in
July 2019 the exports value at current prices went down by 1.5% and the
imports value – by 6.7%, whereas, compared to the previous month, the exports
value went up by 1.6% and the imports value – by 3.8%.
Main
changes in exports in July 2019, compared to July 2018:
- exports of basic metals and
articles of basic metals up by EUR 12.1 mln or 12.9%,
- exports of prepared foodstuffs
up by EUR 11.2 mln or 12%,
- exports of products of the
chemical and allied industries up by EUR 8.1 mln or 11.2%,
- exports of wood and articles of
wood up by EUR 14.3 mln or 7.5%,
- exports of machinery and
mechanical appliances; electrical equipment down by EUR 11.4 mln
or 5.8%.
Main
changes in imports in July 2019, compared to July 2018:
- imports of mineral products up
by EUR 29.6 mln or 20.6%,
- imports of products of the
chemical and allied industries up by EUR 16.5 mln or 14.3%,
- imports of plastics and
articles thereof up by EUR 10 mln or 13.6%,
- imports of vehicles, aircraft,
vessels and associated transport equipment down by EUR 68.6 mln
or 35.2%,
- imports of machinery and
mechanical appliances; electrical equipment down by EUR 32.2 mln
or 10.4%.
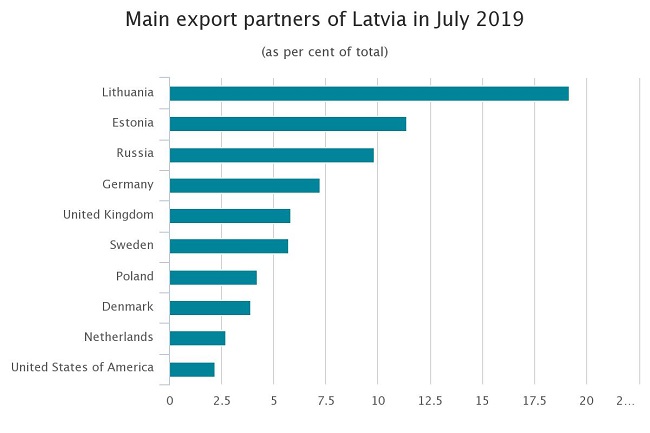
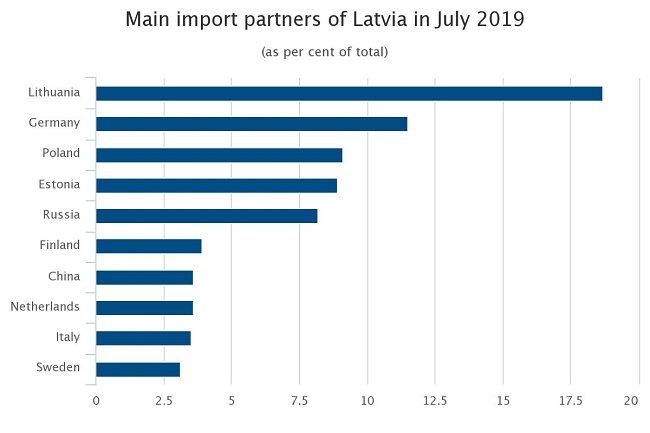
In July,
the main export partners of Latvia in trade with EU countries were Lithuania
(19.2% of total exports), Estonia (11.4%), Germany (7.2%) and United Kingdom
(5.8%). whereas the main import partners were Lithuania (18.7% of total
imports), Germany (11. %), Poland (9.1%) and Estonia (8.9%). The main
partner in trade with third countries was Russia, share of which in total
Latvian exports in July accounted for 9.8%, and in imports – for 8.2%.
In July 2019, compared to July 2018, share of the
European Union countries in Latvian foreign trade grew – by 1.1 percentage
point in the total exports value and by 4.5 percentage points in the imports
value. Rise in share of CIS countries comprised 1.4 percentage points in
exports and 2.5 percentage points in imports.
Foreign
trade of Latvia in July 2019 by country group
(at current prices)
|
|
Exports |
Imports |
||||
|
|
mln EUR |
% of
total |
changes
as %, compared to July 2018 |
mln EUR |
% of
total |
changes
as %, compared to July 2018 |
|
Total |
1 039.4 |
100 |
3.1 |
1 379.7 |
100 |
-0.7 |
|
European Union countries |
755.9 |
72.7 |
4.8 |
1,077.4 |
78.1 |
5.3 |
|
euro area countries |
527.9 |
50.8 |
5.7 |
808.6 |
58.6 |
5.5 |
|
CIS countries |
141.2 |
13.6 |
15.1 |
161.6 |
11.7 |
26.9 |
|
other countries |
142.3 |
13.7 |
-13.0 |
140.7 |
10.2 |
-41.1 |
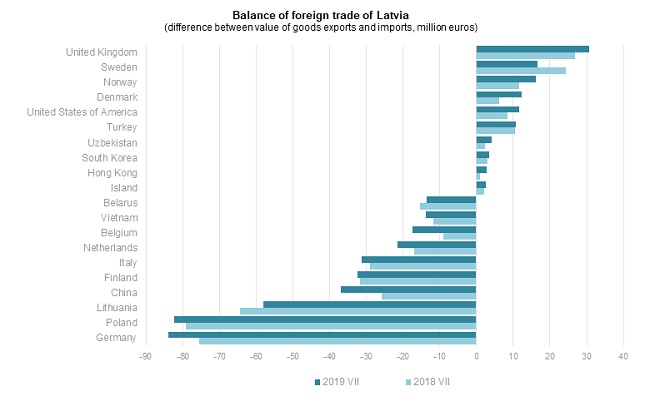
In
July 2019 foreign trade balance of Latvia was positive with 114 partner
countries as exports value of goods exceeded imports value of goods. It was
negative in trade with 53 countries.
Rise of exports of iron and steel in July 2019, as
compared to July 2018, was mostly affected by the increase in exports of
structural iron and steel of EUR 2.8 mln or 26.9%. But exports of
machinery and mechanical appliances reduced as exports of turbojets,
turbopropellers and other gas turbines dropped by EUR 39.6 mln or
99.2%.
Main
commodities in exports of Latvia in July 2019
(at current prices)
|
|
thousand EUR |
as %
of total |
Changes
as %, compared to |
||
|
July 2018 |
June 2019 |
average
of previous 12 months |
|||
|
Total |
1 039 448 |
100 |
3.1 |
5.7 |
-2.3 |
|
wood and articles of wood; wood charcoal |
176 144 |
16.9 |
-7.5 |
-0.7 |
-9.5 |
|
electrical machinery and equipment |
115 812 |
11.1 |
13.3 |
17.7 |
5.7 |
|
machinery and mechanical appliances |
69 786 |
6.7 |
-26.3 |
12.3 |
-7.2 |
|
vehicles other than railway or tramway rolling
stock, and parts and accessories thereof |
58 780 |
5.7 |
-2.7 |
-0.8 |
-1.8 |
|
beverages, spirits and vinegar |
54 161 |
5.2 |
7.2 |
24.7 |
1.8 |
|
mineral fuels, mineral oils and products of their
distillation |
49 582 |
4.8 |
-9.4 |
-2.6 |
-10.6 |
|
iron and steel |
48 384 |
4.7 |
6.9 |
74.0 |
22.4 |
|
pharmaceutical products |
39 796 |
3.8 |
21.0 |
15.2 |
4.9 |
|
articles of iron and steel |
37 149 |
3.6 |
26.3 |
4.6 |
5.7 |
|
plastics and articles thereof |
31 934 |
3.1 |
14.2 |
8.7 |
11.0 |
Rise of imports of mineral fuels, mineral oils and products
of their distillation in July 2019, as compared to July 2018, was
affected by the increase in imports of natural gas of EUR 31.9 mln.
In turn, reduction in imports of machinery and mechanical appliances was mostly
influenced by decrease in imports of turbojets, turbopropellers and other gas
turbines by EUR 49.1 mln or 96%.
Main
commodities in imports of Latvia in July 2019
(at current prices)
|
|
thousand EUR |
as %
of total |
Changes
as %, compared to |
||
|
July 2018 |
June 2019 |
average
of previous 12 months |
|||
|
Total |
1 379 712 |
100 |
-0.7 |
14.1 |
2.8 |
|
mineral fuels, mineral oils and products of their
distillation |
167 804 |
12.2 |
23.4 |
15.3 |
20.6 |
|
electrical machinery and equipment |
141 932 |
10.3 |
8.8 |
20.5 |
4.9 |
|
machinery and mechanical appliances |
134 233 |
9.7 |
-24.5 |
14.2 |
-3.9 |
|
vehicles other than railway or tramway rolling
stock, and parts and accessories thereof |
119 150 |
8.6 |
-5.2 |
1.3 |
6.1 |
|
plastics and articles thereof |
60 788 |
4.4 |
12.1 |
11.5 |
14.9 |
|
beverages, spirits and vinegar |
53 974 |
3.9 |
-14.0 |
-1.1 |
10.4 |
|
iron and steel |
49 612 |
3.6 |
-2.4 |
55.2 |
-4.9 |
|
pharmaceutical products |
47 943 |
3.5 |
6.9 |
-2.0 |
-8.8 |
|
wood and articles of wood; wood charcoal |
41 524 |
3.0 |
-10.7 |
-8.6 |
-16.1 |
|
articles of iron and steel |
37 470 |
2.7 |
19.1 |
5.6 |
18.7 |


 «The Baltic Course» Is Sold and Stays in Business!