Analytics, Latvia, Retail, Statistics
International Internet Magazine. Baltic States news & analytics
Thursday, 25.04.2024, 21:22
In October, retail trade turnover in Latvi grew by 2.4%
 Print version
Compared to October of the previous year, the most significant turnover growth within the non-food products group was recorded in retail sale in non-specialised stores with non-food products predominating (of 17.2%), retail sale of hardware, paints and glass (15.4%), and retail sale of information and communication equipment (12.5%). The largest turnover drop was recorded in retail sale of clothing, footwear and leather goods (of 20.2%), retail sale of cultural and recreation goods (8.0%), as well as retail sale via stalls or markets (16.4%).
The total retail trade turnover at current prices increased by 7.4% (not taking into account the calendar influence).
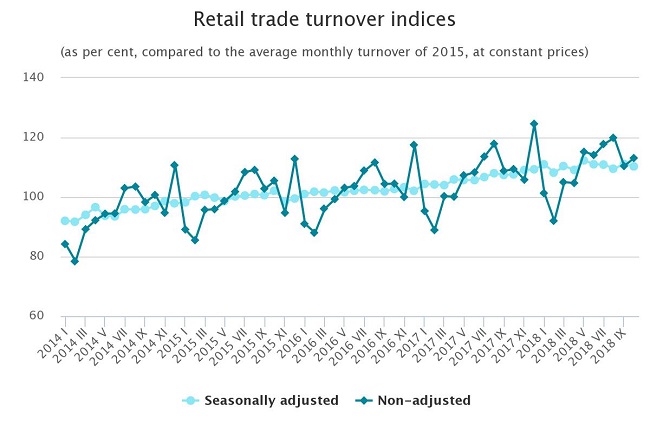
Compared to September, in October 2018 the total turnover of retail trade enterprises fell by 0.7%, according to seasonally adjusted data at constant prices. Turnover of retail trade in food products grew by 1.0%, turnover of retail trade in non-food products, except for retail sale of automotive fuel, declined by 2.5%, while turnover of retail sale of automotive fuel rose by 0.5%.
Turnover increase was recorded in retail sale of electrical household appliances (of 4.6%) as well as retail sale of information and communication equipment (3.5%).
Turnover drop, in turn, was registered in retail sale in non-specialised stores with non-food products predominating (of 9.9%), retail sale of clothing, footwear and leather goods (9.4%), as well as retail sale of cultural and recreation goods (4.6%).
Compared to September, in October 2018 the total retail trade turnover at current prices (not taking into account seasonality) grew by 3.4%.
Turnover indices of retail trade enterprises by main kind of economic activity
(at constant prices)
| October 2018 (%), compared to | |
September 2018 (seasonally adjusted) | October 2017 (calendar adjusted) | |
Retail trade – total | 99.3 | 102.4 |
retail sale of food products, total | 101.0 | 104.3 |
retail sale of non-food products, total | 98.3 | 101.4 |
retail sale in non-specialised stores with non-food products predominating | 90.1 | 117.2 |
retail sale of information and communication equipment in specialised stores | 103.5
| 112.5 |
retail sale of electrical household appliances | 104.6 | 95.1 |
retail sale of hardware, paints and glass | 100.8 | 115.4 |
retail sale of cultural and recreation goods | 95.4 | 92.0 |
retail sale of medical and orthopaedic goods | 101.1 | 105.1 |
retail sale of cosmetic and toilet articles | 101.6 | 110.3 |
retail sale of clothing, footwear and leather goods | 90.6 | 79.8 |
retail sale via stalls and markets | 96.1 | 83.6 |
retail sale via mail order houses or via Internet | 101.0 | 108.6 |
retail sale of automotive fuel | 100.5 | 98.9 |


 «The Baltic Course» Is Sold and Stays in Business!