
Analytics, Inflation, Latvia, Markets and Companies
International Internet Magazine. Baltic States news & analytics
Friday, 19.04.2024, 13:28
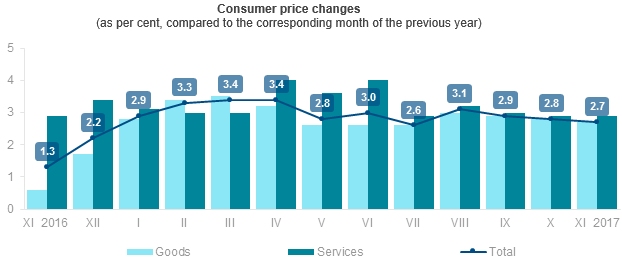
In November, annual inflation in Latvia constituted 2.7%
 Print version
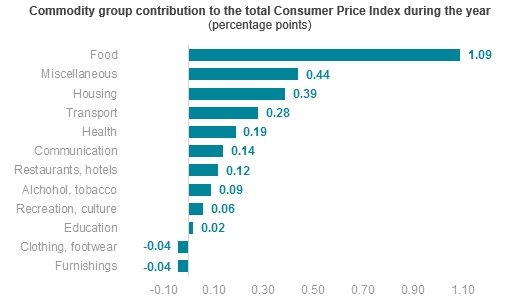
Compared to November 2016,
in November 2017 the average level of consumer prices was mainly affected
by the rise in prices of food and non-alcoholic beverages, prices in the group
of miscellaneous goods and services, goods and services related to housing, prices
of goods and services related to transport, and health care.
The average
level of prices of food and non-alcoholic beverages increased by 4.7%. A rise
was recorded in the prices of milk, milk products, butter, cheese and curd,
yoghurt, meat and meat products, fresh vegetables, fresh fruit, eggs, bakery
products, potatoes and fresh or chilled fish. In turn, a drop was observed in
the prices of sugar and pasta products.
Prices of goods
and services related to housing grew by 2.6%. An increase was observed in the
prices of heat energy, solid fuels, natural gas, refuse collection, as well as
services for the maintenance and repair of the dwelling.
Within the health
care group, the average level of prices went up by 3.3%, which was mainly
influenced by the rise in prices of pharmaceutical products, dental services,
and prices in medical specialist practice.
Prices of goods
and services related to transport increased by 2.1%, which was affected by the
rise in prices of fuels for transport (of 5.1%). Growth was also recorded in
the prices of maintenance and repair of personal transport equipment,
second-hand motor cars. In turn, the prices of passenger transport by air went
down.
Within the group
of miscellaneous goods and services, the average level of prices grew by 8.0%,
which was mostly due to the rise in prices of motor vehicle insurance. An
increase was also recorded in the prices of articles for personal hygiene and
beauty products.
Among other
commodity groups, the most significant growth was recorded in prices of tobacco
products, telecommunication services and catering services. In turn, a decline
was observed in prices of spirits, beer, household cleaning and maintenance
products, and package holidays.
Greatest contribution of goods
and services to changes in the average level of consumer prices over the year
|
Goods,
services |
Percentage
points |
|
Motor
vehicle insurance |
0.33 |
|
Fuels for
transport |
0.28 |
|
Milk products |
0.21 |
|
Heat
energy |
0.18 |
|
Tobacco
products |
0.17 |
|
Butter |
0.16 |
|
Meat and
meat products |
0.15 |
|
Telecommunication
services |
0.15 |
Compared to
October 2017, in November 2017 the average level of consumer prices
went up by 0.1%. Prices of goods grew by 0.3%, while prices of services fell by
0.3%.
In November,
consumer price changes were mainly affected by the growth in prices of food and
non-alcoholic beverages, prices of goods and services related to transport,
goods and services related to housing, as well as the drop in prices in the
recreation and culture group.
Over the month,
prices of food and non-alcoholic beverages rose by 0.6%. An increase was
observed in the prices of fresh vegetables, mainly tomatoes and cucumbers.
Growth was also recorded in the prices of eggs, cheese and curd, bakery
products, as well as dried, salted or smoked meat. In turn, poultry, pork, and
fruit and vegetable juices became cheaper.
Prices of goods
and services related to housing grew by 0.4%. Solid fuels and heat energy
became more expensive, while a drop was recorded in the average price level of
rentals for housing.
Prices of goods
and services related to transport went up by 0.5%, which was mainly due to the
1.4% increase in prices of fuels for transport. In turn, the prices of
passenger transport by air went down.
Within the
recreation and culture group, the average level of prices decreased by 1.6%, as
this was mainly due to the drop in prices of package holidays and pet food.
There was an increase in the prices of flowers.
Among other
commodity groups, the most notable growth was recorded in prices of catering
services, while a decrease was observed in the prices of spirits.
Greatest contribution of goods
and services to changes in the average level of consumer prices over the month
|
Goods,
services |
Percentage
points |
|
Fresh
vegetables |
0.15 |
|
Fuels for
transport |
0.08 |
|
Solid
fuels |
0.05 |
|
Eggs |
0.04 |
|
Pork |
-0.04 |
|
Spirits |
-0.04 |
|
Poultry |
-0.05 |
|
Package
holidays |
-0.11 |
Consumer price changes in
November 2017 by commodity group (as per cent, compared to the corresponding period)
|
Commodity
group |
November 2016 |
December 2016 |
October 2017 |
|
Total |
2.7 |
2.1 |
0.1 |
|
food |
4.7 |
3.3 |
0.6 |
|
alcohol,
tobacco |
1.0 |
0.3 |
-0.6 |
|
clothing,
footwear |
-0.8 |
2.5 |
-0.5 |
|
housing |
2.6 |
1.8 |
0.4 |
|
furnishings |
-0.9 |
-0.1 |
0.2 |
|
health |
3.3 |
3.2 |
-0.1 |
|
transport |
2.1 |
0.4 |
0.5 |
|
communication |
4.0 |
1.0 |
0.2 |
|
recreation,
culture |
0.8 |
0.6 |
-1.6 |
|
education |
1.2 |
1.2 |
0.0 |
|
restaurants,
hotels |
2.5 |
2.2 |
0.5 |
|
miscellaneous |
8.0 |
8.7 |
0.5 |
Information on consumer price
changes in December 2017 will be published on 10 January.
More detailed information on
consumer price changes is available in the Consumer Prices section of the CSB database.
*The annual inflation reflects
consumer price changes, comparing the average price level in the comparison
month with the average price level in the corresponding month of the previous
year.


 «The Baltic Course» Is Sold and Stays in Business!