
Analytics, Estonia, Good for Business, Industry, Markets and Companies
International Internet Magazine. Baltic States news & analytics
Thursday, 18.04.2024, 18:54
In September, production of Estonian industrial enterprises rose by 4% y-o-y
 Print version
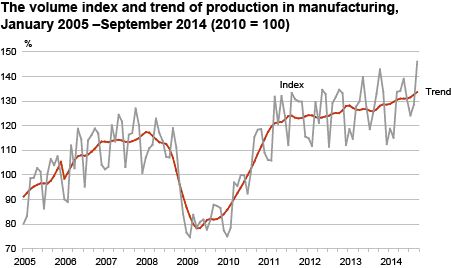
Since January, manufacturing has shown a growth in production compared to the same period of the previous year. While in July the increase in manufacturing was 5% and in August 6%, then in September production rose 7% compared to September of the previous year. Production exceeded the volume of September 2013 in most of the branches of industry. The growth in production was influenced the most by an increase in the manufacture of electronic products, where production rose about a quarter. 6% more wood and 9% more metal products were produced. The volume of production fell in the manufacture of electrical equipment, chemicals and furniture.
In September, 71% of the whole production of manufacturing was sold on the external market. Compared to September 2013, export sales of manufacturing production rose 13% and domestic sales 9% according to unadjusted data.
In September 2014 compared to August, the seasonally adjusted total industrial production increased 1%, including a 2% increase in the production of manufacturing 2%.
Compared to September 2013, the production of electricity fell 13% and the production of heat increased 4%.
Change in volume index of industrial production, September 2014 (percentages)
|
Economic activity |
Change compared |
Change compared to
the corresponding |
|
|
according to |
according to working-day |
||
|
TOTAL |
1.3 |
6.2 |
3.6 |
|
Energy production |
-3.1 |
-10.7 |
-12.1 |
|
Mining |
-3.1 |
-12.6 |
-14.3 |
|
Manufacturing |
1.8 |
9.8 |
6.8 |
|
manufacture of computer, electronic and optical products |
-1.3 |
26.6 |
22.8 |
|
manufacture of wood and wood products |
0.3 |
8.9 |
6.4 |
|
manufacture of food products |
0.0 |
1.9 |
0.3 |
|
manufacture of fabricated metal products |
7.8 |
13.1 |
9.3 |
|
manufacture of electrical equipment |
-4.6 |
1.3 |
-2.3 |
|
manufacture of chemicals and chemical products |
-6.8 |
-3.5 |
-6.5 |
|
manufacture of furniture |
-4.8 |
-8.0 |
-11.2 |
|
manufacture of motor vehicles |
0.0 |
0.9 |
-1.8 |
|
manufacture of building materials |
5.2 |
8.6 |
5.9 |
|
manufacture of machinery and equipment |
11.2 |
33.3 |
28.7 |
|
manufacture of refined petroleum products |
6.1 |
17.1 |
17.1 |
a In case of the seasonally adjusted volume index of industrial production, the impact of the differing number of working days in a month and seasonally recurring factors have been eliminated. It is calculated only in comparison with the previous period.
b In case of the working-day adjusted volume index of industrial production, the impact of the differing number of working days in a month has been eliminated. It is calculated only in comparison with the corresponding period of the previous year.


 «The Baltic Course» Is Sold and Stays in Business!
