
Agriculture, Analytics, Good for Business, Latvia, Markets and Companies
International Internet Magazine. Baltic States news & analytics
Thursday, 25.04.2024, 19:09
Size of agricultural holdings keeps increasing in Latvia
 Print version
The utilised agricultural area (hereinafter – AA) on average per holding increased by 7.0% (from 21.5 ha in 2010 to 23.0 ha in 2013). The largest agricultural holdings were situated in Zemgale, where utilised AA per holding on average amounted to 29.9 ha.
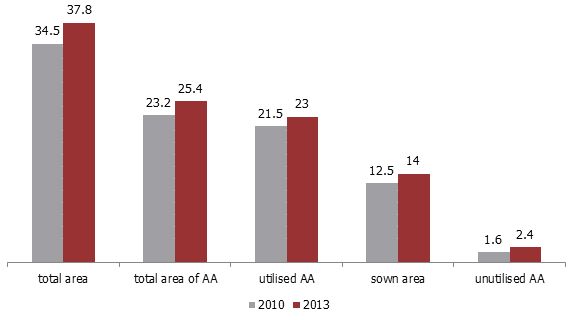 |
| Average size of agricultural holdings, ha |
In 2013, there were 81.8 thsd economically active agricultural holdings in Latvia, and since 2010 the number of holdings has decreased by 1.6 thsd or 1.9%. In 2013, 1201.2 thsd ha or 64.0% of the total utilised AA were owned areas, which is 24.1 thsd ha or 2.0% more than in 2010. The share of leased areas accounted for 34.3% of the total utilised AA (14.2% more than in 2010).
Last year AA amounted to 2074.6 thsd ha, of which 1877.8 thsd ha was utilised AA. Compared to 2010 utilised AA has increased by 81.5 thsd ha or 4.5%. 1207.5 thsd ha (64.3%) of the utilised AA were occupied by arable land, 650.8 thsd ha (34.7%) – by meadows and pastures, 13 thsd ha (0.7%) – by kitchen gardens, and 6.5 thsd ha (0.63 %) – by permanent crops. The largest utilised AA was registered in Vidzeme region, the largest arable areas – in Zemgale region, and the largest area of meadows and pastures – in Latgale region.
In 2013 on average14.8 ha of arable land were farmed per agricultural holding, which is 1.4 ha more than in 2010. The largest arable land areas on average per holding were registered in Zemgale and Kurzeme region – 23.6 ha and 21.1 ha, respectively. Last year 35.6 thsd holdings with the area of arable land under 5 ha managed 4.2% of the total area of arable land. In turn, 3.9 thsd holdings with the area of arable land over 50 ha managed 74% of the total area of arable land.
Compared to 2010 the number of livestock on average per livestock breeding agricultural holding increased; however, the share of livestock breeding holdings declines.
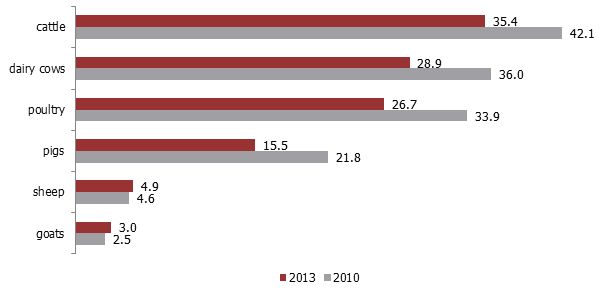 |
| Number of agricultural holdings breeding livestock (as % of the total number of livestock breeding holdings) |
Number of livestock on 1 July 2013
|
|
2010 |
20131 |
||
|
Livestock |
Total, thsd |
On average per holding, ha |
Total, thsd |
On average per holding, ha |
|
Cattle |
394.3 |
11.2 |
412.9 |
14.3 |
|
incl. dairy cows |
166.4 |
5.5 |
166.5 |
7.0 |
|
Pigs |
383.3 |
21.1 |
364.1 |
28.7 |
|
Sheep |
84.3 |
22.2 |
98.4 |
24.7 |
|
Goats |
12.5 |
6.1 |
13.6 |
5.5 |
|
Poultry |
5160.7 |
182.4 |
5034.2 |
230.7 |
In 2013 twelve months before the reference date 173.3 thsd persons were regularly employed in agriculture, of which 52.4% were men and 47.6% – women. Compared to 2010, the number of regular labour force in agriculture has dropped by 7.7 thsd or 4.3%. 30.2 thsd persons or 17.4% of regularly employed labour force worked full time.
More information on the results of Farm Structure Survey 2013 is available in the CSB database.
1Provisional data


 «The Baltic Course» Is Sold and Stays in Business!
