
Analytics, Good for Business, Latvia, Markets and Companies, Retail
International Internet Magazine. Baltic States news & analytics
Saturday, 20.04.2024, 01:57
Latvian industrial production in July grew by 1.4%
 Print version
Of which in manufacturing – by 1.2%, in mining and quarrying – by 5.5%, and in electricity and gas supply – by 1.8%.
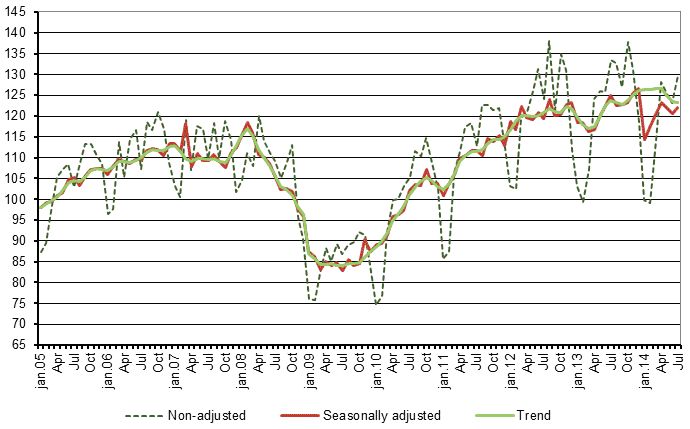 |
| Volume index of manufacturing (2010=100) |
Data source: Central Statistical Bureau of Latvia
In comparison with July 2013, industrial production output in July 2014 (according to calendar adjusted data at constant prices) has reduced by 1.5%, of which in mining and quarrying – by 6.6% and in manufacturing – by 2.6%. In turn, in electricity and gas supply there was a increase of 4.9%.
Production drop in July was recorded in repair and installation of machinery and equipment – of 28.2%, in manufacture of wearing apparel – of 20.4%, in manufacturing of machinery, mechanisms and equipment – of 20% and in manufacture of beverages – of 17.4%.A significant production decrease was also registered in manufacture of basic pharmaceutical products and preparations and in manufacture of other transport equipment (building of ships and boats, manufacture of railway locomotives and rolling stock). But increase in production, in turn, was observed in manufacture of computer, electronic and optical products – of 54.5%, in manufacture of chemicals and chemical products – of 21.9%, in manufacture of wood and cork articles – 12.3%, in manufacture of food products – of 3.3% and in manufacture of fabricated metal products, except machinery and equipment – of 4.2%.
Change in volume of industrial production, % (at constant prices)
|
|
January – July 2014 compared to January – July 2013 (calendar adjusted) |
July 2014 compared to |
|
|
June 2014 |
July 2013 |
||
|
All production |
-1.5 |
1.4 |
-1.5 |
|
Mining and quarrying |
5.6 |
5.5 |
-6.6 |
|
Manufacturing |
0.5 |
1.2 |
-2.6 |
|
Manufacture of food products |
5.6 |
0.1 |
3.3 |
|
Manufacture of textiles |
-5.1 |
8.5 |
-3.8 |
|
Manufacture of wearing apparel |
-17.0 |
-0.2 |
-20.4 |
|
Manufacturing of wood and cork articles, except furniture |
8.5 |
-0.2 |
12.3 |
|
Manufacture of chemicals and chemical products |
20.8 |
-6.6 |
21.9 |
|
Manufacture of other non-metallic mineral products |
5.4 |
-0.1 |
-2.6 |
|
Manufacturing of fabricated metal products, except machinery and equipment |
1.5 |
2.5 |
4.2 |
|
Manufacture of computer, electronic and optical products |
57.8 |
14.5 |
54.5 |
|
Manufacture of electrical equipment |
7.0 |
19.8 |
8.5 |
|
Manufacturing of machinery, mechanisms and equipment |
0.5 |
-6.8 |
-20.0 |
|
Manufacture of motor vehicles, trailers and semi-trailers |
6.6 |
8.4 |
13.5 |
|
Manufacture of furniture |
9.9 |
2.1 |
13.4 |
|
Repair and installation of machinery and equipment (repair and maintenance of ships and boats, repair of fabricated metal products, machinery and equipment, installation of industrial machinery and equipment) |
-24.0 |
9.2 |
-28.2 |
|
Electricity and gas supply |
-9.8 |
1.8 |
4.9 |
More information on seasonally adjusted, calendar adjusted and non-adjusted industrial production volume indices and weights structure used in the calculations is available in the CSB databases.


 «The Baltic Course» Is Sold and Stays in Business!
