
Analytics, Baltic Export, Foreign trade , Good for Business, Latvia
International Internet Magazine. Baltic States news & analytics
Tuesday, 09.06.2026, 07:01
In foreign trade of Latvia exports increases more rapidly than imports in Q1
 Print version
It also impacted foreign trade balance – exports share in total foreign trade volume reached 44.5%. For comparison, in the first three months of previous year it was 43.0%.
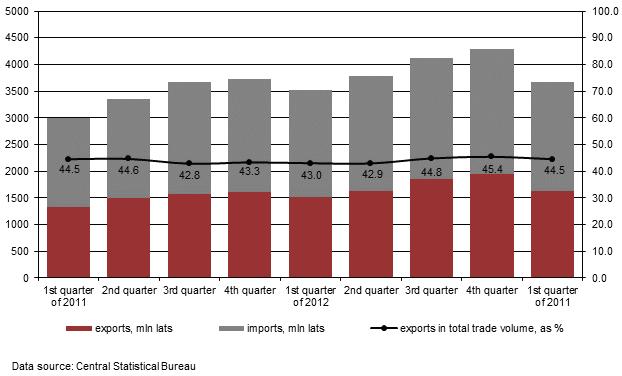 |
| Foreign trade of Latvia at current prices by quarters, mln lats |
Excluding impact of price changes, in the first quarter of this year, compared to first quarter of previous year, exports volume at constant prices rose by 3.6%, but imports volume decreased by 1.6%.
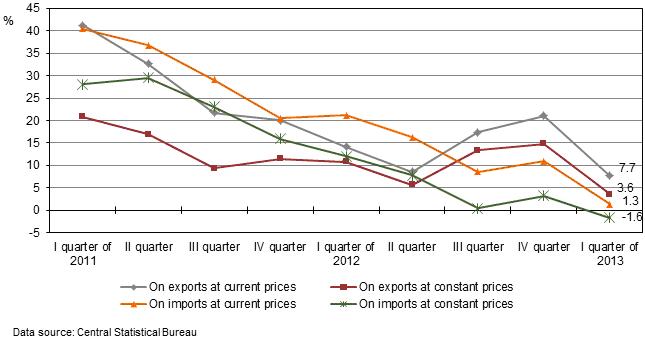 |
| Changes of foreign trade of Latvia at current and constant prices by quarters, as percent of corresponding quarter of previous year |
In the first quarter of 2013 largest volume of goods – two fifths from the total of exports – were exported by manufacturing enterprises. Increase of exports of these enterprises, compared to the first quarter of previous year, comprised 7.0 mln lats or 1.1%.
Structure of foreign trade of Latvia according to the kind of economic activity of enterprises by NACE Rev. 2 classification in the 1st quarter of 2013, at current prices
|
Exporters/importers by main kind of their economic activity |
Exports |
Imports |
||
|
mln lats |
as % of total volume |
mln lats |
as % of total volume |
|
|
Total |
1 634.8 |
100 |
2 034.9 |
100 |
|
Agriculture, forestry and fishing |
28.7 |
1.8 |
7.9 |
0.4 |
|
Mining and quarrying |
13.7 |
0.8 |
3.6 |
0.2 |
|
Manufacturing |
669.0 |
40.9 |
300.9 |
14.8 |
|
Electricity, gas, steam and air conditioning supply |
13.1 |
0.8 |
168.8 |
8.3 |
|
Water supply, sewerage, waste management and remediation activities |
6.0 |
0.4 |
4.1 |
0.2 |
|
Construction |
6.3 |
0.4 |
16.5 |
0.8 |
|
Wholesale and retail trade; repair of motor vehicles and motorcycles |
586.8 |
35.9 |
1 101.2 |
54.1 |
|
Transport and storage |
48.8 |
3.0 |
35.2 |
1.7 |
|
Other kinds of activity; without breakdown by sections |
262.4 |
16.0 |
396.7 |
19.5 |
But in imports more than a half of all goods were imported by enterprises whose main kind of activity is wholesale and retail trade. Compared to the first quarter of previous year, volume of goods imported by these enterprises slightly reduced, however – by 23.5 thsd lats or 2.1%.
Accordingly final consumption of goods statistical data on foreign trade grouped show that in the first three months of the year, compared to the first quarter of previous year, exports of such important component of the national accounts as capital goods has increased rapidly – by 26.1%, but imports, however, has decreased by 17.0%. Share of these goods in exports comprised 10.2%, but in imports – 11.2%. Capital goods consist of fixed assets, raw materials and other materials foreseen for the further processing.
More information on Latvia’s foreign trade by quarters by kind of activity of enterprises (NACE Rev. 2) and by classification of Broad Economic Categories, Rev. 4 (BEC) can be found in the CSB database ”Foreign trade” in section Short term statistical data.


 «The Baltic Course» Is Sold and Stays in Business!
