
Analytics, Baltic Export, Foreign trade , Good for Business, Latvia
International Internet Magazine. Baltic States news & analytics
Tuesday, 09.06.2026, 15:14
Exports in Latvia grew by 5.3%, imports – by 14% in March
 Print version
In March foreign trade balance slightly worsened as exports in total foreign trade value dropped to 43.6% (in February of this year – 45.5%), see picture.
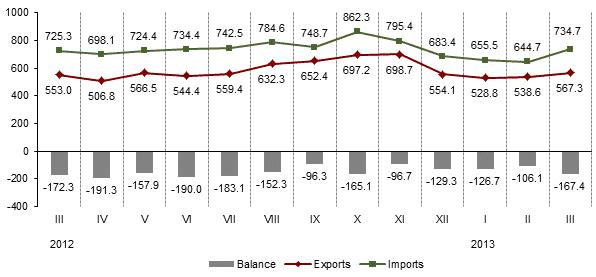 |
| Foreign trade of Latvia, mln. lats [1] |
Main changes in exports in March, compared to February of this year:
- exports of products of the chemical and allied industries grew by 11.1 mln lats or 34.7%,
- exports of wood and articles of wood increased by 6.0 mln lats or 6.8%,
- exports of vegetable products dropped by 8.8 mln lats or 23.3%.
Main changes in imports in March, compared to February of this year:
- imports of mineral products rose by 25.4 mln lats or 21.4%,
- imports of transport vehicles and associated transport equipment increased by 18.6 mln lats or 52.3%,
- imports of metals and articles of metals decreased by 4.6 mln lats or 7.1%.
Exports of machinery and mechanical appliances; electrical equipment in March, compared to February, grew by 6.0 mln lats or 7.0% - to Lithuania by 2.4 mln lats or 12.3% and to Czech Republic - by 1.6 mln lats or 2.1 times. In its turn, imports rose by 24.0 mln lats or 21.8% - from Germany by 6.2 mln lats or 38.0%, from Lithuania by 4.1 mln lats or 37.9%, from Netherlands by 2.8 mln lats or 58.7%.
In March the most significant share in Latvia’s export – 71.6% had export to the countries of European Union, followed by the export to CIS countries with 14.4%. Main export partners were Lithuania (16.4% of total export), Estonia (12.9%), Russia (10.0%), Germany (7.2%) and Poland (6.7%).
In its turn the most significant share in Latvia’s import – 76.1% had import from the countries of European Union, followed by the import from CIS countries with 16.0%. Main import partners were Lithuania (17.8% of total import), Germany (12.1%), Russia (11.7%), Poland (9.1%) and Estonia (7.6%).
Changes of main commodities in Latvia’s exports in March 2013, at current prices
|
|
Thsd lats |
% of total |
% (+, -) over |
|||
|
March 2012 |
February 2013 |
average of previous 12 months |
||||
|
Total |
567 300 |
100 |
+2.6 |
+5.3 |
-3.2 |
|
|
|
wood and articles of wood; wood charcoal |
94 193 |
16.6 |
+1.4 |
+6.9 |
+8.0 |
|
|
electrical machinery and equipment |
58 650 |
10.3 |
+42.8 |
+2.3 |
+14.9 |
|
|
mineral fuels, mineral oils and products of their distillation |
43 839 |
7.7 |
+0.3 |
+10.6 |
-7.0 |
|
|
iron and steel |
38 436 |
6.8 |
-24.7 |
-5.9 |
-19.4 |
|
|
machinery and mechanical appliances |
33 056 |
5.8 |
+14.3 |
+16.6 |
+6.5 |
|
|
beverages, spirits and vinegar |
19 277 |
3.4 |
-1.5 |
-7.3 |
-29.5 |
|
|
land transport vehicles and parts and accessories thereof |
19 240 |
3.4 |
-36.3 |
+3.4 |
-25.7 |
|
|
articles of iron or steel |
18 363 |
3.2 |
-6.1 |
+9.4 |
-0.4 |
|
|
pharmaceutical products |
16 248 |
2.9 |
+14.2 |
+2.8 |
+2.3 |
Rapid growth of exports of electrical machinery and equipmentin March 2013, compared to March of previous year, was mostly impacted by the increase of exports of mobile phones – by 10.9 mln lats or 2.9 times. In its turn, exports of land transport vehicles and parts and accessories thereof decreased as exports of cars and other mechanical vehicles dropped by 9.4 mln lats or 70.8%.
Changes of main commodities in Latvia’s imports in March 2013, at current prices
|
|
Thsd lats |
% of total |
% (+, -) over |
|||
|
March 2012 |
February 2013 |
average of previous 12 months |
||||
|
Total |
734 731 |
100 |
+1.3 |
+14.0 |
+0.2 |
|
|
|
mineral fuels, mineral oils and products of their distillation |
141 278 |
19.2 |
+13.9 |
+22.2 |
+12.6 |
|
|
electrical machinery and equipment |
68 092 |
9.3 |
+18.6 |
+13.4 |
+8.9 |
|
|
machinery and mechanical appliances |
65 690 |
8.9 |
-1.2 |
+32.0 |
-6.4 |
|
|
land transport vehicles and parts and accessories thereof |
46 424 |
6.3 |
-16.1 |
+40.4 |
-7.9 |
|
|
iron and steel |
29 865 |
4.1 |
-30.0 |
-18.3 |
-27.0 |
|
|
plastics and articles thereof |
29 114 |
4.0 |
+12.8 |
+20.1 |
+6.3 |
|
|
pharmaceutical products |
27 509 |
3.7 |
+6.4 |
-9.3 |
+8.2 |
In March, compared to March of previous year, imports of electrical machinery and equipmentrose as imports of mobile phones increased by 9.7 mln lats or 2.6 times. But drop of imports of metal waste and scrap by 7.1 mln lats or 41.0% significantly impacted total imports of iron and steel.
More information on Latvia’s foreign trade by months and quarters by country groups and commodity groups can be obtained in the CSB data base section „Foreign trade” Short term statistical data.
[1] Data on September and October 2012 have been revised.


 «The Baltic Course» Is Sold and Stays in Business!
