
Analytics, Baltic Export, Foreign trade , Good for Business, Latvia
International Internet Magazine. Baltic States news & analytics
Tuesday, 09.06.2026, 06:39
Foreign trade of Latvia in January-June increased by 13.5%
 Print version
1 Data on the 2nd, 3rd and 4th quarters of 2011 and 1st quarter of 2012 have been revised.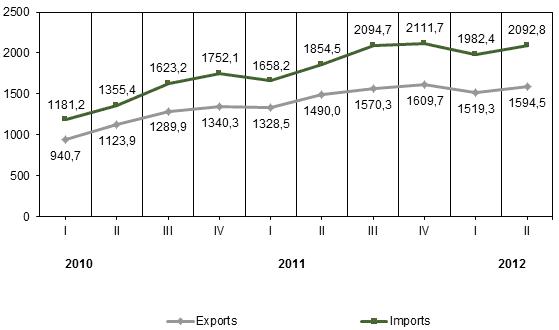
Foreign trade of Latvia at current prices by quarter, million LVL (1)
In the result of price changes the volume of both – export and import at constant prices in January – June 2012 grew by 7.4% as compared to January – June 2011.
Volume changes of foreign trade of Latvia; at constant prices
|
Period |
Export, % (+, –) over |
Import, % (+, –) over |
||
|
the previous quarter |
the corresponding quarter of the previous year |
the previous quarter |
the corresponding quarter of the previous year |
|
|
1st quarter |
-7.6 |
+11.0 |
-10.6 |
+10.5 |
|
2nd quarter |
+4.1 |
+4.2 |
+4.3 |
+4.6 |
Exports and imports of Latvia according to BEC2 classification, at current prices
|
Commodity groups |
Exports |
Imports |
||||||
|
|
January – June 2011 |
January – June 2012 |
January – June 2011 |
January – June 2012 |
||||
|
|
mln LVL |
as % of total volume |
mln LVL |
as % of total volume |
mln LVL |
as % of total volume |
mln LVL |
as % of total volume |
|
Total |
2 818.5 |
100 |
3 113.8 |
100 |
3 512.7 |
100 |
4 075.2 |
100 |
|
Capital goods |
225.3 |
8.0 |
246.7 |
7.9 |
420.3 |
12.0 |
504.0 |
12.4 |
|
Intermediate goods |
1 719.2 |
61.0 |
1 776.8 |
57.1 |
1 764.2 |
50.2 |
1 961.6 |
48.1 |
|
Consumer goods |
651.1 |
23.1 |
716.1 |
23.0 |
908.8 |
25.9 |
896.8 |
22.0 |
|
Goods not elsewhere specified; not broken down by category |
121.5 |
4.3 |
305.5 |
9.8 |
229.1 |
6.5 |
542.4 |
13.3 |
|
Passenger motor cars 3 |
100.3 |
3.6 |
66.2 |
2.1 |
129.6 |
3.7 |
108.8 |
2.7 |
|
Automotive fuel 3 |
1.1 |
0.0 |
2.5 |
0.1 |
60.7 |
1.7 |
61.6 |
1.5 |
2 Classificationby Broad Economic
Categories.
3 Commodities included
in several BEC categories.
According to the BEC classification, exported and imported goods can be grouped in categories by possible kind of their utilisation.Capital goods are composed of fixed assets, intermediate goods – of industrial supplies provided for further processing. Goods produced for the needs of the population are treated as consumer goods. Other goods not included in the above-mentioned categories (e.g., military equipment and other specific goods) are included in the category “goods not elsewhere specified”.
Composition of foreign trade of Latvia by kind of economic activity of enterprises according to NACE Rev.2 classification in January – June 2012, at current prices
|
Exporters/importers by main kind of economic activity |
Exports |
Imports |
|||
|
mln LVL |
as % of total volume |
mln LVL |
as % of total volume |
||
|
Total |
3 113.8 |
100 |
4 075.2 |
100 |
|
|
Agriculture, forestry and fishing |
63.4 |
2.0 |
27.2 |
0.7 |
|
|
Mining and quarrying |
28.6 |
0.9 |
7.5 |
0.2 |
|
|
Manufacturing |
1 330.5 |
42.7 |
657.3 |
16.1 |
|
|
|
of which: |
|
|
|
|
|
|
manufacture of food products, beverages and tobacco |
160.0 |
5.1 |
134.3 |
3.3 |
|
|
manufacture of textiles, apparel |
78.0 |
2.5 |
50.8 |
1.2 |
|
|
manufacture of wood and paper products; printing |
382.5 |
12.3 |
67.3 |
1.7 |
|
|
manufacture of chemicals and chemical products; manufacture of pharmaceuticals, medical chemical and botanical products |
118.0 |
3.8 |
76.2 |
1.9 |
|
|
manufacture of rubber and plastics products, and other non-metallic mineral products |
96.0 |
3.1 |
54.9 |
1.3 |
|
|
manufacture of basic metals and fabricated metal products |
273.3 |
8.8 |
146.8 |
3.6 |
|
|
manufacture of computer, electronic and optical products; manufacture of electrical equipment |
83.9 |
2.7 |
48.1 |
1.2 |
|
|
manufacture of transport equipment |
51.9 |
1.7 |
28.0 |
0.7 |
|
|
manufacture of furniture |
33.4 |
1.1 |
12.6 |
0.3 |
|
|
other manufacturing sectors |
53.5 |
1.7 |
38.3 |
0.9 |
|
Electricity, gas, steam and air conditioning supply |
27.1 |
0.9 |
295.8 |
7.3 |
|
|
Water supply, sewerage, waste management and remediation activities |
15.5 |
0.5 |
5.1 |
0.1 |
|
|
Construction |
17.6 |
0.6 |
41.1 |
1.0 |
|
|
Wholesale and retail trade; repair of motor vehicles and motorcycles |
1 124.6 |
36.1 |
2 262.9 |
55.5 |
|
|
Transport and storage |
109.4 |
3.5 |
73.9 |
1.8 |
|
|
Other sections; without breakdown by section |
397.1 |
12.8 |
704.4 |
17.3 |
|


 «The Baltic Course» Is Sold and Stays in Business!
