
Analytics, Good for Business, Industry, Latvia, Markets and Companies
International Internet Magazine. Baltic States news & analytics
Tuesday, 09.06.2026, 13:04
Industrial production output in Latvia grew by 6% in May y-o-y
 Print version
In comparison with April 2012, industrial production output in May 2012 (according to seasonally adjusted data at constant prices) has increased by 1.9%, of which in electricity and gas supply by 6.3%, whereas in manufacturing there was a reduction of 0.2% and in mining and quarrying – of 6.4%.
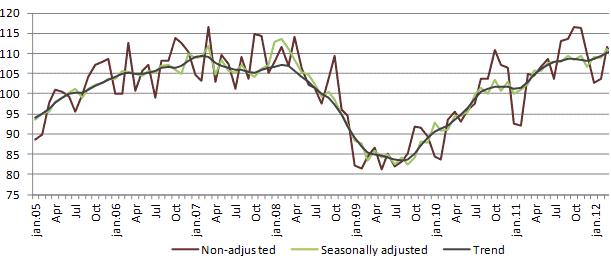 |
| Industrial production volume index (2005=100) |
Compared to May of the previous year, industrial production output in May 2012 (according to calendar adjusted data at constant prices) has grown by 6%. Of which in manufacturing – by 7.3%, in electricity and gas supply – by 2.4%, while in mining and quarrying there was a decrease of 3.9%.
In its turn, among manufacturing sectors the most notable rise was recorded in
manufacture of basic metals – of 38.1%, in manufacture of other transport
equipment (building of ships and boats, manufacture of railway locomotives and
rolling stock) – by 26.8% and in manufacture of chemicals and chemical products
– by 21.3%. Whereas reduction was observed in other manufacturing (manufacture
of medical and dental instruments and supplies, manufacture of games and toys,
manufacture of sports goods etc.) – of 18.8%, in manufacture of basic
pharmaceutical products and pharmaceutical preparations – of 12.3%, and in
manufacture of wearing apparel – of 3.7%.
Changes in volume of industrial production, % (at constant prices)
|
|
May 2012 compared to |
|
|
April 2012 (seasonally adjusted) |
May 2011 (calendar adjusted) |
|
|
All production |
1.9 |
6.0 |
|
Mining and quarrying |
-6.4 |
-3.9 |
|
Manufacturing |
-0.2 |
7.3 |
|
Manufacture of food products |
1.6 |
1.5 |
|
Manufacture of textiles |
0.6 |
5.3 |
|
Manufacture of wearing apparel |
0.1 |
-3.7 |
|
Manufacture of wood and cork articles, except furniture |
0.7 |
8.4 |
|
Manufacture of chemicals and chemical products |
-1.2 |
21.3 |
|
Manufacture of basic pharmaceutical products and pharmaceutical preparations |
4.0 |
-12.3 |
|
Manufacture of other non-metallic mineral products |
4.3 |
2.0 |
|
Manufacture of basic metals |
4.5 |
38.1 |
|
Manufacture of fabricated metal products, except machinery and equipment |
-1.2 |
9.1 |
|
Manufacture of computer, electronic and optical products |
-1.7 |
14.7 |
|
Manufacture of electrical equipment |
8.9 |
16.0 |
|
Manufacture of motor vehicles, trailers and semi-trailers |
-1.8 |
20.8 |
|
Manufacture of other transport equipment (building of ships and boats, manufacture of railway locomotives and rolling stock) |
24.0 |
26.8 |
|
Manufacture of furniture |
2.9 |
-0.3 |
|
Repair and installation of machinery and equipment (repair and maintenance of ships and boats, repair of fabricated metal products, machinery and equipment, installation of industrial machinery and equipment) |
-27.3 |
9.7 |
|
Electricity and gas supply |
6.3 |
2.4 |
More information on seasonally
adjusted, calendar adjusted and non-adjusted industrial production volume
indices is available in the CSB data base.
_________
1 Data are compiled on
economically active enterprises, which in industrial production employ 20 and
more persons, or in which industrial turnover previous year exceeded LVL 300
thousand.
Industrial production volume in accordance with the Statistical Classification of Economic Activities NACE Rev. 2 includes mining and quarrying, manufacturing and electricity, gas, steam and air conditioning supply, except steam and air conditioning supply.


 «The Baltic Course» Is Sold and Stays in Business!
