
Analytics, Good for Business, Industry, Latvia, Markets and Companies
International Internet Magazine. Baltic States news & analytics
Tuesday, 09.06.2026, 07:46
Industrial production output in Latvia grew by 8.9% in 2011
 Print version
Of which in manufacturing – by 11.5%, in mining and quarrying – by 8%, and in electricity and gas supply – by 0.9%. The growth in industrial production mainly was stimulated by the successful work of wood processing and metalworking sectors as well as enterprises engaged in repair and installation of machinery and equipment.
The most notable growth of industrial production in manufacturing was recorded in manufacture of motor vehicles, trailers and semi-trailers – of 59.7%, in manufacture of electrical equipment – of 48.1%, and in manufacture of machinery and equipment – of 37.1%. Whereas reduction in 2011, if compared to 2010, was observed in 4 sectors: manufacture of chemicals and chemical products, manufacture of beverages, manufacture paper and paper products, other manufacturing (manufacture of medical and dental instruments and supplies, manufacture of games and toys, manufacture of sports goods etc.)
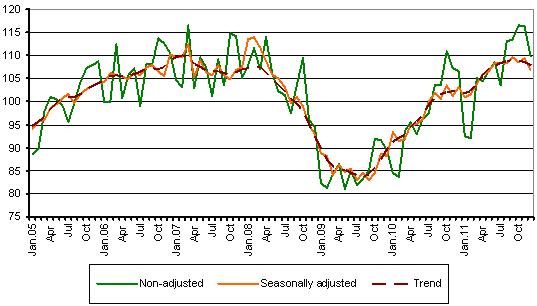 |
| Industrial production volume index (2005=100) |
In comparison with 3rd quarter of 2011, industrial production output in the 4th quarter of 2011 has decreased by 0.5%, according to seasonally adjusted data at constant prices. Of which in mining and quarrying – by 0.4%, in electricity and gas supply – by 5%, whereas manufacturing there was an increase of 1.9%.
Compared to corresponding quarter of previous year, industrial production output in the 4th quarter of 2011 has risen by 5.6%, according to calendar adjusted data at constant prices. Of which in manufacturing – by 9.1%, in mining and quarrying – by 24%, but in electricity and gas supply there was a decrease of 6.8%.
In comparison with November 2011, industrial production output in December 2011 has reduced by 2.4%, according to seasonally adjusted data at constant prices, of which in manufacturing – by 1.6%, in mining and quarrying – by 9% and in electricity and gas supply – by 4.9%.
Compared to December a year before, industrial production output in December 2011 has increased by 3.2%, according to calendar adjusted data at constant prices. Of which in mining and quarrying – by 53.1%, in manufacturing – by 9.6%, but in electricity and gas supply there was a decrease of 14.9%.
Changes in volume of industrial production (at constant prices)
|
|
I – XII 2011 as% over I – XII 2010 (calendar adjusted) |
X – XII 2011 as% over |
XII 2011 as % over |
||
|
2011 VII – IX (seasonally adjusted) |
X-XII 2010 (calendar adjusted) |
XI 2011 (seasonally adjusted) |
XII 2010 (calendar adjusted) |
||
|
All production |
8.9 |
-0.5 |
5.6 |
-2.4 |
3.2 |
|
Mining and quarrying |
8.0 |
-0.4 |
24.0 |
-9.0 |
53.1 |
|
Manufacturing |
11.5 |
1.9 |
9.1 |
-1.6 |
9.6 |
|
Manufacture of food products |
0.9 |
0.0 |
0.5 |
-0.3 |
2.8 |
|
Manufacture of textiles |
1.5 |
-1.4 |
-1.1 |
-6.0 |
-9.4 |
|
Manufacture of wearing apparel |
28.1 |
-12.5 |
1.8 |
-15.1 |
-10.9 |
|
Manufacture of wood and cork articles, except furniture |
12.4 |
4.6 |
14.4 |
2.2 |
16.9 |
|
Manufacture of chemicals and chemical products |
-3.5 |
18.8 |
5.3 |
3.0 |
3.3 |
|
Manufacture of basic pharmaceutical products and pharmaceutical preparations |
12.3 |
5.7 |
5.4 |
-22.2 |
-15.4 |
|
Manufacture of other non-metallic mineral products |
23.9 |
12.1 |
21.0 |
-1.2 |
26.8 |
|
Manufacture of basic metals |
0.0 |
-8.9 |
-15.3 |
2.1 |
-14.3 |
|
Manufacture of fabricated metal products, except machinery and equipment |
34.2 |
-2.4 |
27.5 |
-12.5 |
18.6 |
|
Manufacture of computer, electronic and optical products |
15.8 |
-1.5 |
14.4 |
8.3 |
30.9 |
|
Manufacture of electrical equipment |
48.1 |
10.3 |
60.9 |
3.9 |
70.3 |
|
Manufacture of motor vehicles, trailers and semi-trailers |
59.7 |
-4.7 |
54.9 |
-2.7 |
58.8 |
|
Manufacture of other transport equipment (building of ships and boats, manufacture of railway locomotives and rolling stock) |
18.5 |
-22.1 |
-17.7 |
-32.4 |
-36.8 |
|
Manufacture of furniture |
4.9 |
-3.0 |
-3.9 |
-0.8 |
0.3 |
|
Repair and installation of machinery and equipment (repair and maintenance of ships and boats, repair of fabricated metal products, machinery and equipment, installation of industrial machinery and equipment) |
14.6 |
5.7 |
23.6 |
16.7 |
57.7 |
|
Electricity and gas supply |
0.9 |
-5.0 |
-6.8 |
-4.9 |
-14.9 |
More information on seasonally adjusted, calendar adjusted and non-adjusted industrial production volume indices is available in the data base of CSB.
1 Data are compiled on economically active enterprises employing 20 and more persons in industrial production or industrial turnover in which previous year exceeded LVL 300 thousand.
Industrial production volume in accordance with the Statistical Classification of Economic Activities NACE Rev. 2 includes mining and quarrying, manufacturing and electricity, gas, steam and air conditioning supply, except steam and air conditioning supply.


 «The Baltic Course» Is Sold and Stays in Business!
