
EU – Baltic States, Good for Business, Innovations, Rating
International Internet Magazine. Baltic States news & analytics
Wednesday, 24.04.2024, 02:58
European Innovation Scoreboard: Estonia is a Strong Innovator, Latvia and Lithuania in the Modest Innovators group in EU
 Print version
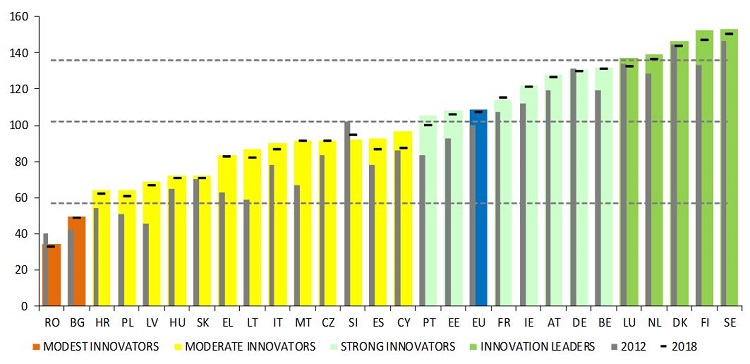
Sweden continues to be the EU innovation leader, followed by
Finland, Denmark and the Netherlands. This year Luxembourg (previously a strong
innovator) joins the innovation leaders, while Portugal (previously a moderate
innovator) joins the group of strong innovators.
This year’s scoreboard is marked by the United Kingdom’s withdrawal from the
EU. This has had a small impact on the EU’s average innovation performance, but
the relative performance of EU countries in relation to EU’s global performance
remains unaffected.
At the global level, the EU has surpassed the United States
for the second time. The EU continues to have a performance lead over the
United States, China, Brazil, Russia, South Africa, and India. Since 2012, the
EU’s performance gap with South Korea, Australia and Japan has increased, while
the EU’s performance lead over the United States, China, Brazil, Russia and
South Africa has decreased.
The EIS 2020 applies the same methodology as last year’s
edition. However, results should not be compared across editions due to data
revisions. Time series of the results are presented in the current edition
which compare tracked performance since 2012 based on the most recent data.
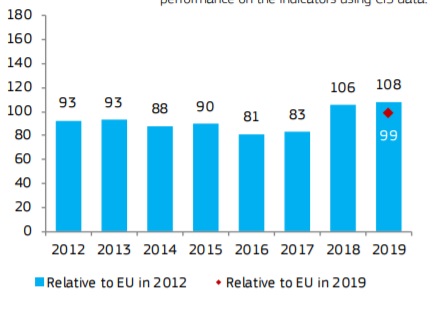
Estonia is a Strong Innovator
Over time, performance has increased relative to that of the
EU in 2012. The strong increase in 2018 is largely explained by improved
performance on the indicators using CIS data. Linkages, Human resources, and
Intellectual assets are the strongest innovation dimensions. Estonia scores
high on Innovative SMEs collaborating with others, Trademark applications,
Lifelong learning, and Non-R&D innovation expenditures. Sales impacts,
Employment impacts and Innovation-friendly environment are the weakest
innovation dimensions. Low-scoring indicators include SMEs with marketing or
organizational innovations, R&D expenditures in the business sector,
Employment in fast-growing enterprises of innovative sectors, and Medium and
high-tech product exports. Structural differences with the EU are shown in the
table below.
Estonia shows the highest positive difference to the EU in
Total Entrepreneurial Activity, Average annual change in GDP and FDI net
inflows, and the biggest negative difference in Top R&D spending
enterprises, Turnover share large enterprises and Employment share high and
medium high-tech manufacturing.
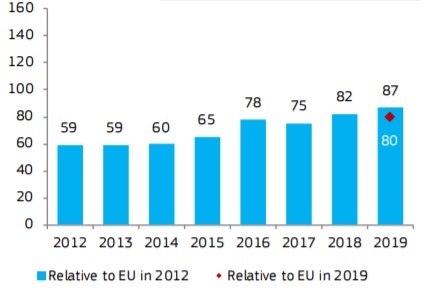
Lithuania is a Moderate Innovator
Over time, performance has increased relative to that of the
EU in 2012. The strong increase in 2018 is largely explained by improved
performance on the indicators using CIS data. Innovators, Innovation-friendly
environment, and Linkages are the strongest innovation dimensions. Lithuania
scores high on Population with tertiary education, Innovative SMEs
collaborating with others, Non-R&D innovation expenditures, and Broadband
penetration. Attractive research systems, Sales impacts and Intellectual assets
are the weakest innovation dimensions. Low-scoring indicators include Exports
of knowledgeintensive services, R&D expenditures in the business sector,
Public-private co-publications, and Foreign doctorate students.
Structural differences with the EU are shown in the table
below. Lithuania shows the highest positive difference to the EU in Average
annual change in GDP, Total Entrepreneurial Activity and Enterprise births, and
the biggest negative difference in Top R&D spending enterprises, Employment
share high and medium high-tech manufacturing and Employment share
knowledge-intensive services.
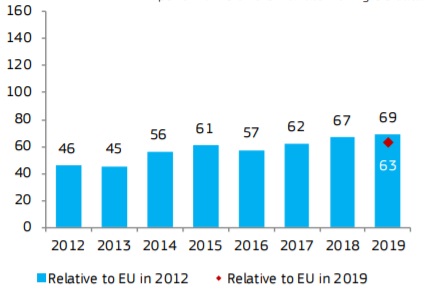
Latvia is a Moderate Innovator.
Over time, performance has increased relative to that of the
EU in 2012. The strong increase in 2018 is entirely explained by improved
performance on the indicators using CIS data.
Finance and support, Employment impacts and
Innovation-friendly environment are the strongest innovation dimensions.
Performance is relatively high for Venture capital expenditures, Population
with tertiary education, Employment in fast-growing enterprises of innovative
sectors, and Trademark applications. Innovators, Attractive research systems
and Sales impacts are the weakest innovation dimensions. Latvia’s lowest
indicator scores are on R&D expenditures in the business sector, New
doctorate graduates, Public-private co-publications, and SMEs innovating
in-house. Structural differences with the EU are shown in the table below.
Latvia shows the highest positive difference to the EU in
Total Entrepreneurial Activity, Average annual change in GDP and Enterprise
births, and the biggest negative difference in Top R&D spending
enterprises, Employment share high and medium high-tech manufacturing and
Turnover share large enterprises.
- 28.01.2022 BONO aims at a billion!
- 26.08.2021 LLC Dizozols Investments finalizes investment attraction deal with Crowdestor with record-high profits
- 13.02.2021 Моя жизнь в газете. Очерки по новейшей истории Латвии. Глава 1
- 30.12.2020 Накануне 25-летия Балтийский курс/The Baltic Course уходит с рынка деловых СМИ
- 30.12.2020 On the verge of its 25th anniversary, The Baltic Course leaves business media market
- 30.12.2020 Business Education Plus предлагает анонсы бизнес-обучений в январе-феврале 2021 года
- 30.12.2020 Hotels showing strong interest in providing self-isolation service
- 30.12.2020 EU to buy additional 100 mln doses of coronavirus vaccine
- 30.12.2020 ЕС закупит 100 млн. дополнительных доз вакцины Biontech и Pfizer
- 29.12.2020 Latvia to impose curfew, state of emergency to be extended until February 7


 «The Baltic Course» Is Sold and Stays in Business!
