
Foreign trade , Good for Business, Latvia, Statistics
International Internet Magazine. Baltic States news & analytics
Friday, 26.04.2024, 01:24
Latvian exports of goods up 9.3% in January-May, imports grow 7.9%
 Print version
In May 2018, Latvian exports rose 6.2% from April 2018 and 8.5% against
May 2017 to EUR 1.047 bln. Imports increased 11.6% from April 2018 and rose
10.4% against May 2017 to EUR 1.277 bln.
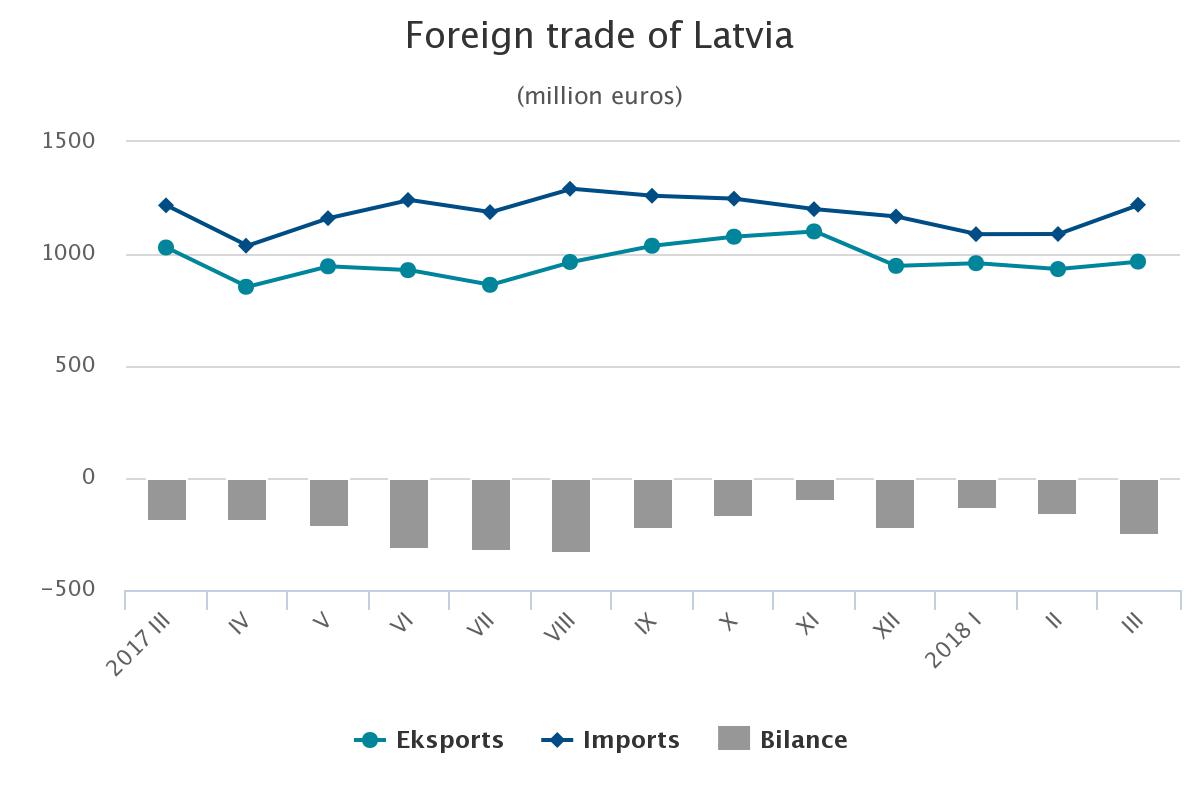
Compared to May 2017, Latvia's foreign trade balance worsened slightly as
the share of exports decreased from 45.5% to 45%.
In May 2018, Latvian timber, timber products and charcoal were exported
for EUR 197.824 mln or 18.9% of total exports, growing 6.5% from April 2018 and
17.4% from May 2017. Exports of electric appliances and equipment accounted for
EUR 97.476 mln or 9.3% of total exports, up 10.7% month-on-month and down 13.7%
year-on-year.
Machinery and mechanical appliances prevailed in Latvian imports in May
2018 at EUR 192.426 mln or 15.1% of total imports, soaring 51.7% from April
2018 and surging 73.6% from May 2017. Imports of electric appliances and
equipment made up EUR 118.963 mln or 9.3% of total imports, up 0.4% from April
2018 but down 7% year-on-year.
In May 2018, Latvia's main export partners in the EU included Lithuania,
which received 16.4% of Latvia's total exports, Estonia (11.8%), Sweden (7%)
and Germany (6.6%), while the key import partners were Lithuania (18.1% of
total imports), Germany (10.6%), Poland (8.7%) and Estonia (8.2%).
Russia was Latvia's main partner in trade with third countries as its share in total Latvian exports in May 2018 accounted for 9%, whereas in imports for 6.2%.
Foreign trade of Latvia in April 2018 by country group
(at current prices)
|
|
Exports |
Imports |
||||
|
|
million
euros |
% of total |
changes
as %, compared to May 2017 |
million
euros |
% of total |
changes
as %, compared to May 2017 |
|
Total |
1 047.0 |
100 |
8.5 |
1 277.5 |
100 |
10.4 |
|
European
Union countries |
756.6 |
72.3 |
6.2 |
974.7 |
76.3 |
3.5 |
|
euro area
countries |
511.0 |
48.8 |
5.3 |
729.6 |
57.1 |
3.8 |
|
CIS
countries |
132.5 |
12.7 |
12.2 |
122.9 |
9.6 |
11.6 |
|
other
countries |
157.9 |
15.0 |
17.9 |
179.9 |
14.1 |
70.5 |
Main commodities in exports of Latvia in May 2018
(at current prices)
|
|
thousand euros |
% of total |
Changes as %, compared to |
||
|
May 2017 |
April 2018 |
average of previous 12 months |
|||
|
Total |
1 046 968 |
100 |
8.5 |
6.2 |
6.3 |
|
wood and articles of wood; wood charcoal |
197 824 |
18.9 |
17.4 |
6.5 |
20.9 |
|
electrical machinery and equipment |
97 476 |
9.3 |
-13.7 |
10.7 |
-7.1 |
|
machinery and mechanical appliances |
96 673 |
9.2 |
82.6 |
43.4 |
34.9 |
|
vehicles other than railway or tramway rolling
stock, and parts and accessories thereof |
59 384 |
5.7 |
3.1 |
0.7 |
8.2 |
|
beverages, spirits and vinegar |
54 945 |
5.2 |
38.8 |
36.6 |
8.4 |
|
iron and steel |
50 608 |
4.8 |
57.0 |
38.3 |
34.3 |
|
mineral fuels, mineral oils and products of their
distillation |
41 344 |
3.9 |
2.2 |
2.8 |
0.7 |
|
articles of iron or steel |
34 865 |
3.3 |
8.5 |
-3.7 |
6.6 |
|
pharmaceutical products |
32 506 |
3.1 |
-17.2 |
-0.8 |
-9.4 |
|
furniture; bedding, mattresses, cushions and similar
stuffed furnishings; prefabricated buildings |
30 577 |
2.9 |
11.9 |
9.1 |
3.8 |
Main commodities in imports of Latvia in May 2018
(at current prices)
|
|
Thousand euros |
% of total |
Changes as %, compared to |
||
|
May 2017 |
April 2018 |
average of previous 12 months |
|||
|
Total |
1 277 525 |
100 |
10.4 |
11.6 |
7.2 |
|
machinery and mechanical appliances |
192 426 |
15.1 |
73.6 |
51.7 |
50.5 |
|
electrical machinery and equipment |
118 963 |
9.3 |
-7.0 |
0.4 |
-9.3 |
|
vehicles other than railway or tramway rolling
stock, and parts and accessories thereof |
106 876 |
8.4 |
-1.8 |
4.2 |
3.2 |
|
mineral fuels, mineral oils and products of their
distillation |
93 273 |
7.3 |
-12.2 |
16.6 |
-8.8 |
|
iron and steel |
61 244 |
4.8 |
41.9 |
14.4 |
26.4 |
|
beverages, spirits and vinegar |
59 255 |
4.6 |
45.9 |
53.0 |
27.2 |
|
plastics and articles thereof |
56 440 |
4.4 |
-0.02 |
4.4 |
10.4 |
|
wood and articles of wood; wood charcoal |
54 342 |
4.3 |
34.2 |
8.8 |
33.8 |
|
pharmaceutical products |
51 098 |
4.0 |
3.5 |
-0.4 |
1.6 |
|
articles of iron or steel |
32 880 |
2.6 |
4.2 |
17.4 |
13.1 |


 «The Baltic Course» Is Sold and Stays in Business!
