
Analytics, Energy, Estonia, Good for Business, Industry, Markets and Companies
International Internet Magazine. Baltic States news & analytics
Thursday, 25.04.2024, 03:53
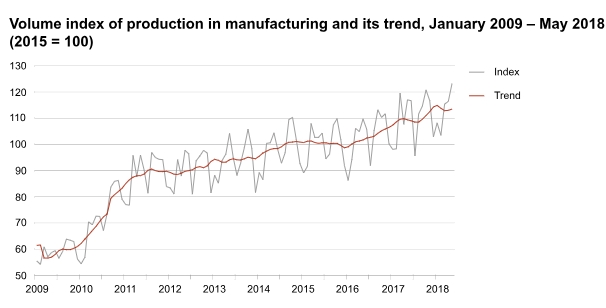
In May, the volume of industrial production was 3% greater in Estonia
 Print version
In May, the total production in manufacturing was 5% higher compared to the
corresponding month of 2017. In May, over a half of the branches of industry
exceeded the volume of the same month of the previous year. The growth in
production was mostly due to an increase in the manufacture of food products,
manufacture of wood as well as manufacture of electronic equipment. Production
increased considerably also in the manufacture of chemical products and refined
petroleum products. Among the branches of industry with larger shares,
production fell in the manufacture of metal products and furniture.
In May, 68% of the
total production of manufacturing was sold to the external market. According to
unadjusted data, sales of manufacturing production for exports increased by 5%
and sales to the domestic market increased by 2% compared to May 2017.
In May 2018,
compared to April, the seasonally adjusted total industrial production
decreased by 0.4%. The production of manufacturing increased compared to the
previous month by 1%.
Compared to May
2017, the production of electricity decreased by 30%, but the production of
heat increased by 50%.
|
Change in volume index of industrial production, May 2018 (percentages) |
||||
|
Economic activity |
Change on previous month according to seasonally adjusted dataa |
Change on
same month of previous year |
|
|
|
according to unadjusted data |
according to working-day adjusted datab |
|
||
|
TOTAL |
-0.4 |
3.0 |
3.0 |
|
|
Energy production |
-18.0 |
-14.1 |
-14.1 |
|
|
Mining |
17.2 |
2.4 |
2.4 |
|
|
Manufacturing |
1.2 |
5.3 |
5.3 |
|
|
manufacture
of wood and wood products |
4.9 |
12.3 |
12.3 |
|
|
manufacture of food products |
1.9 |
6.8 |
6.8 |
|
|
manufacture
of computer, electronic and optical products |
1.1 |
22.0 |
22.0 |
|
|
manufacture
of fabricated metal products |
-5.9 |
-6.4 |
-6.4 |
|
|
manufacture of electrical equipment |
-4.6 |
-5.0 |
-5.0 |
|
|
manufacture of furniture |
3.4 |
-7.6 |
-7.6 |
|
|
manufacture of motor vehicles |
7.9 |
15.0 |
15.0 |
|
|
manufacture of building materials |
5.1 |
-0.3 |
-0.3 |
|
|
manufacture
of machinery and equipment |
-1.5 |
13.3 |
13.3 |
|
|
manufacture of chemical products |
-2.1 |
5.9 |
5.9 |
|
a In the case
of the seasonally adjusted volume index, the impact of different number of
working days in a month and seasonally recurring factors has been eliminated.
It is calculated only in comparison with the previous period.
b In the case
of the working-day adjusted volume index, the impact of different number of
working days in a month has been eliminated. It is calculated only in
comparison with the corresponding period of the previous year.
The statistics are based on the questionnaires “Industry”, the submission
date of which was 17.06.2018, and “Energy production, sales and fuel
consumption”, the submission date of which was 10.06.2018. Statistics Estonia
published the monthly overview in 10 working days. For the statistical activity
“Production indices”, the main representative of public interest is the
Ministry of Economic Affairs and Communications, commissioned by whom
Statistics Estonia collects and analyses the data necessary for conducting this
statistical activity.


 «The Baltic Course» Is Sold and Stays in Business!
