
Analytics, Baltic Export, Financial Services, Foreign trade , Good for Business, Lithuania, Markets and Companies
International Internet Magazine. Baltic States news & analytics
Thursday, 25.04.2024, 10:21
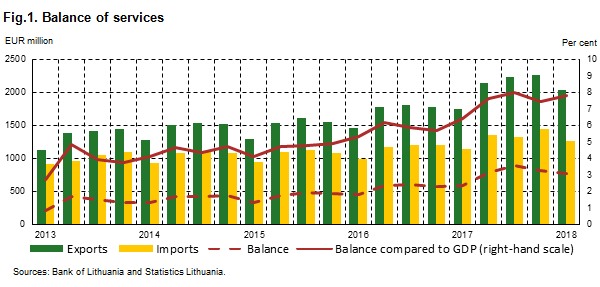
In Q1, the surplus of balance of services amounted to 7.8% of GDP in Lithuania
 Print version
This stemmed from exports of services having grown faster than imports – 17.2 and 10.5% respectively.
Compared to I quarter 2017, the fastest growth was recorded in the exports of transport services – 19.7%. Imports of financial services grew by 57.3%, yet the proportion of these services in total imports accounted for 3%.
Transport services comprised the bulk of exports and imports of services (61.1 and 53.1% respectively). In I quarter 2018, the largest surplus (EUR 451.8 million) was recorded in the balance of road transport services, while the largest deficit (EUR 44.0 million) was on the balance of sea transport services.
Exports of services to the EU countries accounted for 64.8% of total exports of services, to CIS countries – 19.7%. Imports of services from the EU countries accounted for 62.3% of total imports of services, from CIS countries – 21.7%.
In I quarter 2018, against I quarter 2017, exports of services to the EU countries grew by 19.3%, to CIS countries – 16.1%. Over the year, imports of services from the EU countries grew by 12.5%, from the CIS countries – 4.7%.
Germany was Lithuania’s major partner in exports of services in I quarter 2018. Exports of services to this country grew by 38.3% over the year. Exports of services to Russia – second country in terms of export volumes – grew 9.6%. The largest share of total exports of services to Germany was comprised of transport (71.4%) and other business (9.4%) services, to Russia – transport (71.2%) and travel (20%) services.
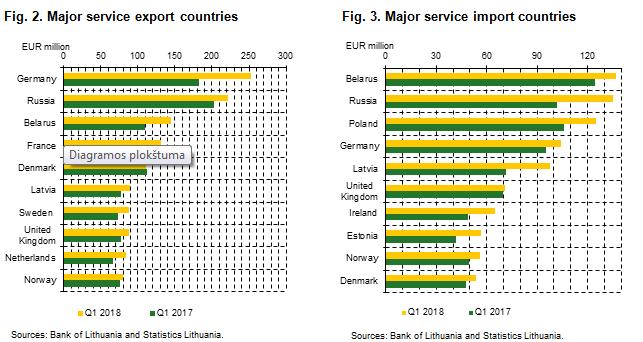
The major partner in imports of services in the reference period was Belarus. Imports of services from this country increased by 5.4% over the year, from Russia (second major partner) – by 2.7%. The composition of services imported from Belarus and Russia was almost the same. The largest share of imports of services from Belarus consisted of transport and travel services (73.7 and 19.6% respectively), from Russia – 71.4 and 18.8% respectively.
Composition of exports and imports of services, I quarter 2018
|
|
Exports |
Imports |
||||
|
EUR million |
share, % |
Compared to I
quarter 2017 % |
EUR million |
share, % |
Compared to I
quarter 2017 % |
|
|
Total services |
2 044.4 |
100.0 |
17.2 |
1 270.6 |
100.0 |
10.5 |
|
Technical maintenance and repair services |
55.6 |
2.7 |
-5.1 |
34.1 |
2.7 |
8.9 |
|
Transport services |
1 248.5 |
61.1 |
19.7 |
675.1 |
53.1 |
8.0 |
|
Passengers services |
43.5 |
2.1 |
16.6 |
39.9 |
3.1 |
2.8 |
|
Freight services |
705.8 |
34.6 |
16.4 |
318.4 |
25.1 |
7.3 |
|
Other transport services |
499.2 |
24.4 |
25.1 |
316.8 |
24.9 |
9.4 |
|
Travel |
190.7 |
9.3 |
9.7 |
198.0 |
15.6 |
2.5 |
|
Construction |
60.8 |
3.0 |
5.6 |
7.1 |
0.6 |
-43.5 |
|
Financial services |
31.7 |
1.5 |
11.9 |
38.3 |
3.0 |
57.3 |
|
Telecommunications. computer and information services |
128.7 |
6.3 |
16.1 |
74.8 |
5.9 |
14.8 |
|
Telecommunications services |
22.3 |
1.1 |
0.1 |
21.7 |
1.7 |
-10.6 |
|
Computer services |
101.5 |
5.0 |
19.8 |
48.1 |
3.8 |
25.2 |
|
Information services |
4.9 |
0.2 |
25.4 |
5.0 |
0.4 |
2.1 t. |
|
Other business
services |
194.0 |
9.5 |
17.6 |
196.0 |
15.4 |
28.9 |
|
Research and
technological development services |
7.8 |
0.4 |
-22.8 |
2.0 |
0.2 |
12.9 |
|
Professional
and advisory management services |
68.1 |
3.3 |
21.5 |
55.0 |
4.3 |
26.4 |
|
Technical.
trade-related and other business services |
118.1 |
5.8 |
19.5 |
139.0 |
10.9 |
30.2 |
|
Other undistributed
services |
134.4 |
6.6 |
25.5 |
47.2 |
3.7 |
1.6 |
Sources: Bank of Lithuania and Statistics Lithuania.
Detailed data on export and import of services for I quarter 2018 is available on the Bank of Lithuania website (under External statistics).
Statistical data on exports and imports of services in II quarter 2018 will be published in September 2018.
Concepts
Exports of services refer to services provided by Lithuanian economic agents to non-residents.
Imports of services refer to services provided by non-residents to Lithuanian residents.
Resident refers to natural or legal person whose place of economic interests is within the economic area of certain country and who carries out long-term (lasting more than a year) economic activity in that country.


 «The Baltic Course» Is Sold and Stays in Business!
