
Analytics, Good for Business, Lithuania, Markets and Companies, Retail
International Internet Magazine. Baltic States news & analytics
Wednesday, 24.04.2024, 16:33
The turnover of retail trade in Lithuania increased by 5.9% in May y-o-y
 Print version
Over the month, the turnover of enterprises trading in food products, seasonally and calendar adjusted, increased by 1.1, of those trading in non-food products – decreased by 0.2, of those engaged in retail trade of automotive fuel – decreased by 1.1% at constant prices.
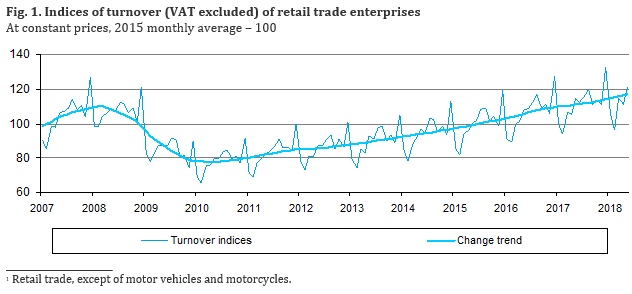
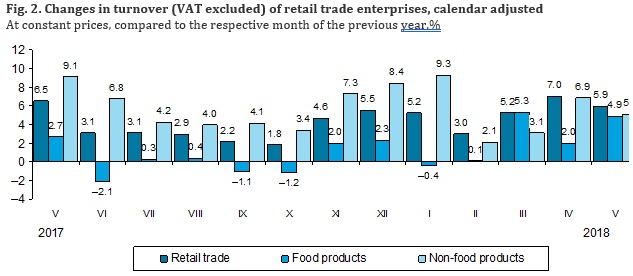
Over the year (in May 2018, against May 2017), the turnover (VAT excluded) of retail trade enterprises, calendar adjusted, increased by 5.9% at constant prices (unadjusted – 5.9%). The turnover of enterprises trading in food products, calendar adjusted, increased by 4.9, of those trading in non-food products – 5.1, of those engaged in retail trade of automotive fuel – 9.2% at constant prices.

Changes in turnover (VAT excluded), at constant prices, %
|
Economic activities (NACE Rev. 2) |
May 2018, against |
January–May 2018 |
||||
|
April 2018,
seasonally and calendar adjusted |
April 2018 |
May 2017, calendar adjusted |
May 2017 |
January–May 2017, calendar adjusted |
January–May 2017 |
|
|
Division 47. Retail
trade1 |
0.2 |
9.5 |
5.9 |
5.9 |
5.3 |
5.4 |
|
Retail trade,
except for sale of automotive fuel |
0.4 |
10.6 |
5.1 |
5.1 |
3.8 |
3.9 |
|
Food,
alcoholic beverages and tobacco |
1.1 |
12.0 |
4.9 |
5.1 |
2.5 |
2.7 |
|
In non-specialised stores |
0.9 |
12.0 |
5.1 |
5.3 |
2.6 |
2.8 |
|
In specialised stores |
6.4 |
13.1 |
–2.7 |
–2.7 |
–3.5 |
–3.5 |
|
Non-food products |
–0.2 |
9.1 |
5.1 |
5.0 |
5.3 |
5.3 |
|
in specialised stores |
|
|
|
|
|
|
|
Textiles, clothing and footwear |
–2.7 |
5.7 |
8.6 |
8.6 |
7.2 |
7.2 |
|
Audio and
video equipment, recordings, metal articles, paints and glass, electrical
household appliances, furniture and lighting equipment |
–0.5 |
10.5 |
6.3 |
6.1 |
6.0 |
6.0 |
|
Information
and communication equipment, cultural and recreation goods, watches,
jewellery and other new goods |
–0.9 |
10.4 |
–6.4 |
–6.5 |
–6.6 |
–6.7 |
|
Pharmaceuticals
and medical goods and cosmetics |
0.7 |
5.4 |
0.5 |
0.8 |
2.2 |
2.4 |
|
Retail sale
via mail order houses or via Internet |
1.5 |
13.4 |
11.4 |
11.0 |
21.2 |
21.0 |
|
In non-specialised stores |
7.2 |
20.0 |
63.6 |
63.6 |
35.8 |
35.8 |
|
Retail sale of
automotive fuel |
–1.1 |
6.1 |
9.2 |
9.0 |
10.9 |
11.0 |
|
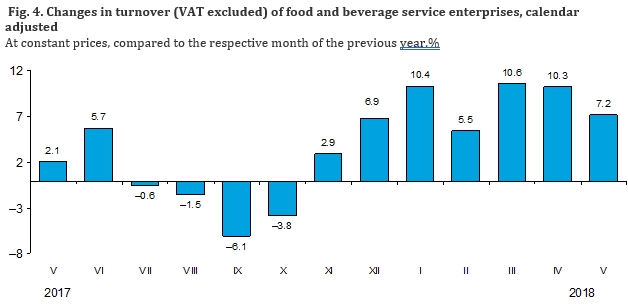
Division 56. Food and beverage service activities |
–0.2 |
9.1 |
7.2 |
7.2 |
8.8 |
8.8 |
For more information, see the Database of Indicators.


 «The Baltic Course» Is Sold and Stays in Business!
