
Analytics, Energy, Good for Business, Latvia
International Internet Magazine. Baltic States news & analytics
Wednesday, 17.04.2024, 23:18
In 2017, amount of electricity produced in hydro and wind power plants in Latvia up by 70.5%
 Print version
In 2017, the rise in consumption of renewables was facilitated by the production of energy resources that grew by 5.6%, compared to 2016. Significant increase (of 70.5% or 6.7 PJ) was recorded in the amount of primary electricity produced in hydro power plants (up by 73.2%) and wind power plants (up by 17.1%). Together in these power plants generated 4531 GWh of electricity, of which 4381 GWh were produced in hydro power and 150 GWh in wind power plants. Last year, the large amount of electricity generated in hydro power plants, which may be explained by the unusually high precipitation amounts and high water inflow in river Daugava, had the greatest upward effect on the amount of electricity produced.
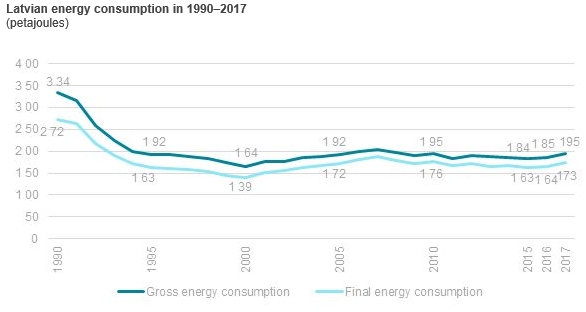
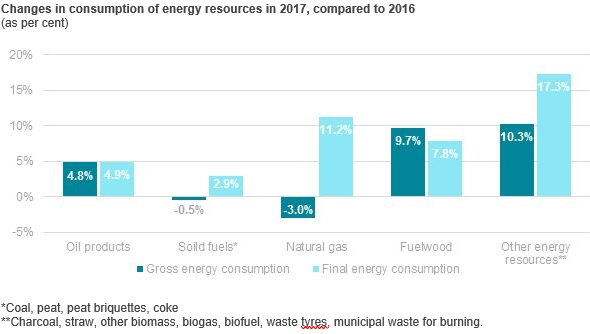
Over the recent years, the structure of gross energy consumption has changed – as the share of natural gas is declining and the proportion of renewables is growing. Over the ten years, the share of natural gas consumption dropped by 5 percentage points, constituting 23.4% in 2017, the share of renewables reached 32.9%, and the share of fuelwood rose by 7.1 percentage points, comprising 30.5%. Compared to 2016, in 2017 the amount of wood chips produced rose by 8.7%, of firewood by 5.5%, and of pelleted wood by 35%. Last year, 0.6 PJ of pelleted wood were produced, which is 79.4% more than in 2016. As the gross consumption of renewables is growing, the
Latvian energy dependence2 fell from 63.9% in 2005 to 47.2% in 2016.
As the gross consumption of renewables is increasing, Latvia is getting closer to the strategic objective regarding use of renewable energy resources aiming at reaching 40% of the energy produced from renewables in the gross final energy consumption until 2020. Latvia has the third highest share of renewables in the final energy consumption in the European Union (EU); in 2016, the indicator constituted 37.2% (EU average 17%). The EU Member States shall ensure that until 2020 the share of renewables consumed in transport sector is 10%. In 2016, Latvian share of renewables in transport constituted 2.8% and EU average 7.1%.
In 2017, 53 PJ of energy resources were consumed for production of heat and electricity (in transformation sector3) and 40.8 PJ of energy were produced (of which 30 PJ of heat and 10.8 PJ of electricity), which is 4.1% less than in 2016. Decline in the amount of electricity produced in transformation sector is caused by the rise in amount of electricity produced in hydro and wind power plants. Production of heat and electricity in Latvia mainly is based on fossil fuel – natural gas, the share whereof in transformation sector has been decreasing gradually: from 81% in 2010 and 60.1% in 2016 to 56.1% in 2017. The share of renewables consumed in transformation sector has risen by 14.9 percentage points over the five years, reaching 43.5% in 2017. It may be assessed as a positive trend, bearing in mind that the renewables used in transformation sector are local resources fuelwood, biogas, and other biomass.
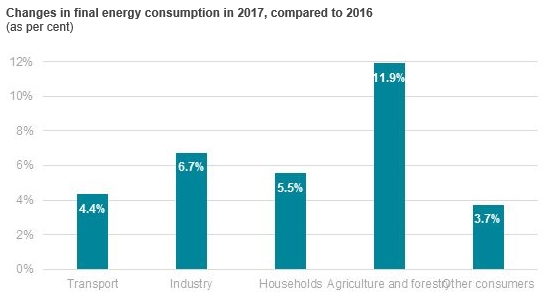
In 2017, final energy consumption constituted 173 PJ, which is 5.4% more than in 2016. Over the last ten years, no notable changes were recorded in the final energy consumption. Last year, transport sector consuming 30% of the energy resources, was the largest consumer of energy sources, followed by households (29.2%) and industry (21%). Compared to 2016, rise in the final consumption of energy was recorded in all sectors, however agriculture and forestry indicated the most notable increase – of 11.9%.
Over the past five years, consumption of energy resources in transport sector has gone up by 14.6%, reaching 51.9 PJ in 2017. Diesel oil is the main energy resource used in the transport sector, and the share thereof constituted 65.4% in 2017. During the recent years, significant increase in the share of liquefied petroleum gas (LPG) consumed may be observed. In 2010, the indicator constituted 1 PJ, whereas in 2017 – 2.4 PJ or 2.5 times more. In its turn, compared to 2016, the consumption of LPG has dropped by 5.8%. Over the past five years, consumption of motor petrol in transport sector declined by 8.6%, reaching 8 PJ in 2017, which is 4% less than in 2016.
During the last five years, consumption of energy resources in industry almost has not changed. Since 2013, it reduced by 1.6%, in 2017 reaching 36.3 PJ. In 2017, the greatest energy consumption was recorded in manufacture of wood and of products of wood and cork – 19.7 PJ or 54.2% of the final energy consumption in industry. Compared to 2016, energy consumption in this sector grew by 4.7%, as the amount of pelleted wood and wood briquettes produced diminished. Last year, manufacture of basic metals indicated the most notable decline – of 34.7%, compared to 2016.
In 2017, consumption of energy resources in households amounted to 50.6 PJ, which is 5.5% more than in 2016. Structure of energy resource consumption in households does not change notably year by year; fuelwood is the most commonly used energy resource. Compared to 2016, consumption of natural gas in households has dropped notably (by 10.9%), while consumption of electricity has gone up (by 8.1%).
Methodological explanations
1 Gross consumption of energy resources includes consumption of energy resources in heat and electricity production sector (transformation sector), and final consumption, which includes all sectors of national economy, as well as households.
2Energy dependence is an indicator that is calculated by subtracting the volume of exports from the volume of imports of energy resources and dividing this number by total energy consumption and summing with bunkering.
3Transformation sector includes the volume of energy resources produced for sale.


 «The Baltic Course» Is Sold and Stays in Business!
