
Analytics, Baltic Export, Good for Business, Latvia, Markets and Companies
International Internet Magazine. Baltic States news & analytics
Saturday, 20.04.2024, 16:31
In April, foreign trade turnover in Latvia rose by 13%
 Print version
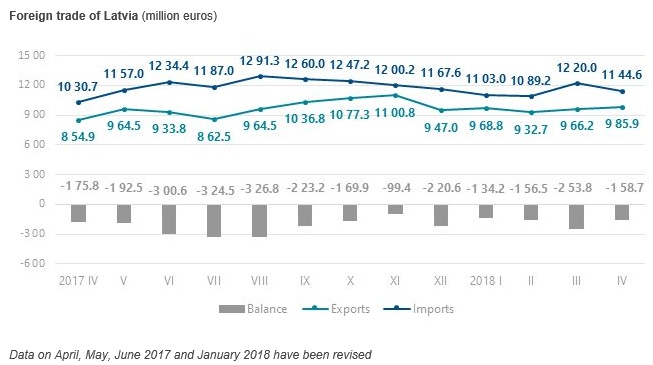
Over the first four months of this year, the foreign trade turnover of Latvia at current prices reached EUR 8.41 billion – EUR 613.9 million or 7.9% more than in the corresponding period of 2017. The exports value constituted EUR 3.85 billion (an increase of EUR 317.5 million or 9.0%), whereas the imports value – EUR 4.56 billion (an upturn of EUR 296.4 million or 7.0%).
Calendar and seasonally adjusted data at current prices show that, compared to April 2018, in April 2018 the exports value at current prices went up by 10.0% and the imports value by 5.4%, whereas, compared to the previous month, the exports value increased by 2.9%, but the imports value reduced by 2.0%.
Main changes in exports in April 2018, compared to April 2017:
- exports of wood and articles of wood
up by EUR 36.5 million or 24.4%,
- exports of vegetable products up by
EUR 23.1 million or 48.9%,
- exports of vehicles and associated
transport equipment up by EUR 15.3 million or 29.3%,
- exports of prepared foodstuffs up by
EUR 15.1 million or 22.3%,
- exports of live animals and animal
products down by EUR 4.0 million or 10.6%.
Main changes in imports in April 2018, compared to April 2017:
- imports of machinery and mechanical
appliances; electrical equipment up by EUR 25.4 million or 11.6%,
- imports of basic metals and articles of
basic metals up by EUR 18.1 million or 21.2%,
- imports of prepared foodstuffs up by
EUR 16.8 million or 20.9%,
- imports of vegetable products up by
EUR 14.1 million or 29.9%,
- imports of mineral products down by
EUR 2.0 million or 2.2%.
In April, the main export partners of Latvia in trade with EU countries were Lithuania (15.1% of total exports), Estonia (10.7%), Germany (7.9%) and Sweden (7.8%), whereas the main import partners were Lithuania (17.7% of total imports), Germany (11.3%), Poland (9.1%) and Estonia (7.9%).
The main partner in trade with third countries was Russia, share of which in total Latvian exports in April accounted for 8.7%, but in imports – 6.4%.
Foreign trade of Latvia by country groups in April 2018, (at current prices)
|
|
Exports |
Imports |
||||
|
|
million EUR |
% of total |
changes as%, compared to April 2017 |
million EUR |
% of total |
changes as%, compared to April 2017 |
|
Total |
985.9 |
100 |
15.3 |
1 144.6 |
100 |
11.0 |
|
European Union countries |
696.2 |
70.6 |
14.6 |
884.6 |
77.3 |
6.6 |
|
euro area countries |
455.2 |
46.2 |
11.7 |
658.8 |
57.6 |
7.7 |
|
CIS countries |
127.6 |
12.9 |
23.5 |
113.8 |
9.9 |
19.3 |
|
other countries |
162.1 |
16.5 |
12.6 |
146.2 |
12.8 |
38.2 |
The rise in the exports of cereals in April 2018, as compared to April 2017, was facilitated by an increase in the exports of wheat and meslin by EUR 21.4 million or 95.8%. In turn, exports of iron and steel dropped as exports of waste and scrap of cast iron decreased by EUR 11.8 million or 65.1%.
Main commodities in exports of Latvia in April 2018 (at current prices)
|
|
thousand EUR |
as% of total |
Changes as%,
compared to |
||
|
April 2017 |
March 2018 |
average of
previous 12 months |
|||
|
Total |
985 924 |
100 |
15.3 |
2.0 |
1.9 |
|
wood and articles of wood; wood charcoal |
185 826 |
18.8 |
24.4 |
-2.6 |
16.1 |
|
electrical machinery and equipment |
88 079 |
8.9 |
-8.2 |
-17.9 |
-16.1 |
|
machinery and mechanical
appliances |
67 433 |
6.8 |
40.3 |
9.9 |
-1.3 |
|
vehicles other than railway or tramway rolling stock, and parts and
accessories thereof |
58 983 |
6.0 |
23.3 |
0.1 |
9.7 |
|
cereals |
47 254 |
4.8 |
98.3 |
9.5 times |
38.7 |
|
beverages, spirits and vinegar |
40 234 |
4.1 |
24.9 |
6.1 |
-19.3 |
|
mineral fuels, mineral oils and products of their distillation |
40 213 |
4.1 |
10.0 |
-0.01 |
-1.4 |
|
iron and steel |
36 585 |
3.7 |
-20.1 |
-19.7 |
0.3 |
|
articles of iron and steel |
36 216 |
3.7 |
24.1 |
-1.8 |
12.7 |
|
pharmaceutical products |
32 767 |
3.3 |
-7.3 |
-8.1 |
-8.3 |
Rise of imports of alcoholic and non-alcoholic beverages in April 2018, as compared to April 2017, was affected by the increase in imports of spirits by EUR 5.1 million or 42.6%. In turn, a drop was experienced in the imports of mineral fuels, mineral oils and products of their distillation, as the imports of natural gas in gaseous state dropped by EUR 13.0 million or 73.5%.
Main commodities in imports of Latvia in April 2018 (at current prices)
|
|
thousand EUR |
as% of total |
Changes as%,
compared to |
||
|
April 2017 |
March 2018 |
average of
previous 12 months |
|||
|
Total |
1 144 553 |
100 |
11.0 |
-6.2 |
-3.2 |
|
machinery and mechanical
appliances |
126 886 |
11.1 |
24.9 |
-2.7 |
1.2 |
|
electrical machinery and equipment |
118 532 |
10.4 |
0.1 |
5.1 |
9.4 |
|
vehicles other than railway or tramway rolling stock, and parts and
accessories thereof |
102 608 |
9.0 |
3.7 |
-2.0 |
0.2 |
|
mineral fuels, mineral oils and products of their distillation |
80 000 |
7.0 |
-5.8 |
-27.0 |
-22.2 |
|
plastics and articles thereof |
54 069 |
4.7 |
16.1 |
11.2 |
7.0 |
|
iron and steel |
53 550 |
4.7 |
35.3 |
-16.8 |
13.3 |
|
pharmaceutical products |
51 309 |
4.5 |
8.3 |
-7.1 |
2.0 |
|
wood and articles of wood; wood charcoal |
49 960 |
4.4 |
37.5 |
11.8 |
26.1 |
|
beverages, spirits and vinegar |
38 724 |
3.4 |
42.7 |
2.4 |
-15.0 |
|
articles of iron and steel |
28 004 |
2.4 |
19.1 |
-8.3 |
-2.4 |
More information on the foreign trade of Latvia by month and quarter, as well as by country group and commodity group is available in the Foreign trade section of the CSB database.


 «The Baltic Course» Is Sold and Stays in Business!
