
Analytics, Baltic States – CIS, EU – Baltic States, Foreign trade , Good for Business, Latvia, Markets and Companies
International Internet Magazine. Baltic States news & analytics
Wednesday, 24.04.2024, 02:25
In 2017, foreign trade turnover in Latvia rose by 12.4%
 Print version
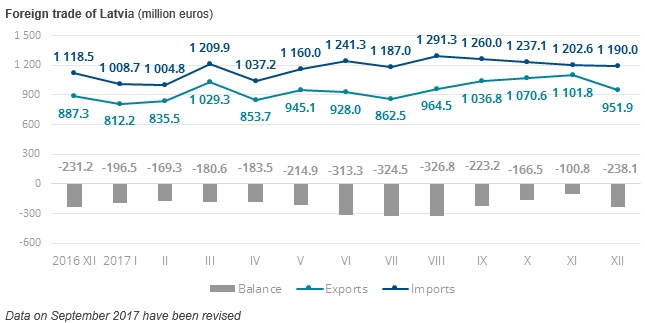
In December 2017, the
foreign trade turnover of Latvia amounted to EUR 2.14 bln, which at
current prices was 6.8% more than in December 2016, of which the exports
value of goods was 7.3% and imports value of goods was 6.4% higher. In
December, Latvia exported goods in the amount of EUR 951.9 mln but
imported – in the amount of EUR 1.19 bln. Compared to
December 2016, foreign trade balance has improved slightly as exports in
total foreign trade amount increased from 44.2% to 44.4%.
Calendar and seasonally
adjusted data at current prices show that, compared to December 2016, in
December 2017 the exports value went up by 12.7% and the imports value by
11.7%, whereas, compared to the previous month, the exports value remained the
same while the imports value increased by 4.2%.
Main changes in exports in
December 2017, compared to December 2016:
- exports of vegetable products up by EUR 40.2 mln or 2.0 times,
- exports of prepared foodstuffs up by EUR 13.6 mln or 15.1%,
- exports of products of the chemical and allied industries up by EUR 10.8 mln or 15.0%,
- exports of mineral products up by EUR 9.1 mln or 19.9%,
- exports of optical instruments and apparatus (including medical); clocks and watches, musical instruments down by EUR 6.9 mln or 24.1%.
e
Main changes in imports in December 2017, compared to December 2016:
- imports of machinery and mechanical appliances; electrical equipment up by EUR 50.7 mln or 20.8%,
- imports of basic metals and articles of basic metals up by EUR 24.4 mln or 30.2%,
- imports of prepared foodstuffs up by EUR 15.0 mln or 16.5%,
- imports of vehicles, aircraft, vessels and associated transport equipmentup by EUR 12.3 mln or 11.4%,
- imports of mineral products down by EUR 11.9 mln or 11.5%.
In December 2017, the main export partners of Latvia in trade with EU countries were Lithuania (17.6% of total exports), Estonia (11.5%), Germany (7.2%) and Sweden (5.6%), whereas the main import partners were Lithuania (17.4% of total imports), Germany (11.4%), Poland (8.7%) and Estonia (8.3%).
Foreign trade of Latvia in
December 2017 by country group, (at current prices)
|
|
Exports |
Imports |
||||
|
|
mln EUR |
% of total |
changes as%, compared to December 2016 |
mln EUR |
% of total |
changes as%, compared to December 2016 |
|
Total |
951.9 |
100 |
7.3 |
1 190.0 |
100 |
6.4 |
|
European
Union countries |
659.7 |
69.3 |
4.9 |
921.6 |
77.4 |
8.6 |
|
euro area
countries |
467.1 |
49.1 |
9.5 |
679.9 |
57.1 |
8.0 |
|
CIS
countries |
150.7 |
15.8 |
11.6 |
134.3 |
11.3 |
7.1 |
|
other countries |
141.5 |
14.9 |
14.6 |
134.1 |
11.3 |
-7.0 |
Russia was the main partner in
trade with third countries; its share in total Latvian exports in December
accounted for 10.7%, whereas in imports – for 8.3%.
Main commodities in exports of
Latvia in December 2017 (at current
prices)
|
|
thsd EUR |
as% of total |
Changes as%,
compared to |
||
|
December 2016 |
November 2017 |
average of
previous 12 months |
|||
|
Total |
951 864 |
100 |
7.3 |
-13.6 |
0.8 |
|
wood and articles of wood; wood charcoal |
140 695 |
14.8 |
-2.6 |
-21.1 |
-10.4 |
|
electrical
machinery and equipment |
104 074 |
10.9 |
-1.7 |
-5.1 |
0.7 |
|
machinery
and mechanical appliances |
71 154 |
7.5 |
12.3 |
30.1 |
16.5 |
|
beverages,
spirits and vinegar |
58 351 |
6.1 |
21.4 |
-20.9 |
21.4 |
|
vehicles other than railway or tramway rolling stock, and parts and accessories
thereof |
54 273 |
5.7 |
5.1 |
-17.7 |
4.2 |
|
mineral fuels, mineral oils and products of their distillation |
50 272 |
5.3 |
18.6 |
9.4 |
25.6 |
|
cereals |
45 589 |
4.8 |
2.8 times |
-38.7 |
43.4 |
|
pharmaceutical
products |
42 947 |
4.5 |
15.3 |
5.9 |
19.8 |
|
articles of iron and steel |
26 329 |
2.8 |
5.6 |
-19.1 |
-15.3 |
|
iron and
steel |
23 598 |
2.5 |
1.1 |
-43.5 |
-33.8 |
The rise in the exports of
cereals in December 2017, as compared to November 2016, was
facilitated by an increase in the exports of wheat and meslin by
EUR 29.0 mln or 5.3 times. In turn, a drop was experienced in
the exports of wood and articles of wood; wood charcoal as exports of fuelwood
fell by EUR 9.7 mln or by 30.1%.
Main commodities in imports of
Latvia in December 2017 (at current
prices)
|
|
thsd EUR |
As % of total |
Changes as %, compared to |
||
|
December 2016 |
November 2017 |
average of
previous 12 months |
|||
|
Total |
1 190 011 |
100 |
6.4 |
-1.0 |
2.3 |
|
machinery
and mechanical appliances |
153 197 |
12.9 |
38.3 |
19.5 |
34.4 |
|
electrical
machinery and equipment |
140 827 |
11.8 |
6.3 |
-4.0 |
10.4 |
|
vehicles other than railway or tramway rolling stock, and parts and
accessories thereof |
113 932 |
9.6 |
11.7 |
4.7 |
15.5 |
|
mineral fuels, mineral oils and products of their distillation |
87 307 |
7.3 |
-12.2 |
-2.5 |
-18.2 |
|
iron and
steel |
53 628 |
4.5 |
37.1 |
64.7 |
30.2 |
|
pharmaceutical
products |
51 349 |
4.3 |
3.5 |
-9.0 |
1.2 |
|
plastics
and articles thereof |
45 633 |
3.8 |
25.2 |
-4.7 |
-7.7 |
|
beverages,
spirits and vinegar |
44 005 |
3.7 |
22.1 |
-33.1 |
-0.4 |
|
wood and articles of wood; wood charcoal |
38 119 |
3.2 |
4.5 |
-2.4 |
0.3 |
|
articles of iron and steel |
29 357 |
2.5 |
37.3 |
4.2 |
9.6 |
The rise in the imports of
machinery and mechanical appliances in December 2017, as compared to
December 2016, was facilitated by an increase in the imports of turbojets,
turbopropellers and other gas turbines by EUR 30.4 mln.In turn, a drop
was experienced in the imports of mineral fuels, mineral oils and products of
their distillation, as the imports of natural gas in gaseous state dropped by
EUR 12.7 mln or 41.2%.
More information on the
foreign trade of Latvia by month and quarter, as well as by country group and
commodity group is available in the Foreign trade section of the CSB
database.


 «The Baltic Course» Is Sold and Stays in Business!
