
Analytics, Employment, EU – Baltic States, Good for Business, Labour-market, Latvia, Markets and Companies
International Internet Magazine. Baltic States news & analytics
Thursday, 18.04.2024, 16:09
Latvian employment rate in Q3 - the highest recorded over the past two decades
 Print version
In the 3rd quarter
of 2017, in Latvia there were 903.0 thousand employed persons aged 15–74,
which is 8.0 thousand more than a year ago.
Compared to the previous
quarter of 2017, in the 3rd quarter employment rate rose by
1.0 percentage points, while the number of employed persons by
11.3 thousand. The most significant increase in the number of employed
persons was recorded within the age groups 45–54 and 55–64 (5.8 thousand
and 2.8 thousand, respectively).
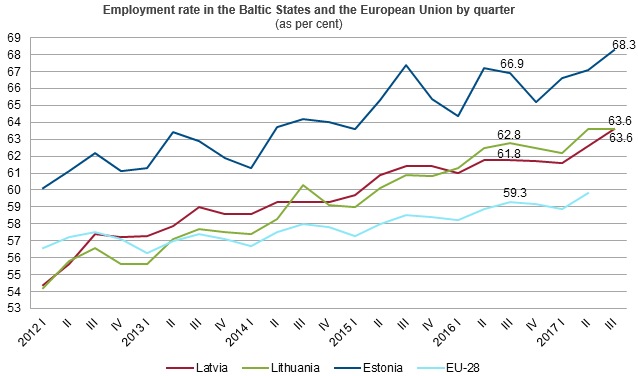
Since the end of the 4th quarter
of 2012, Latvian employment rate has been exceeding the European Union (EU)
average indicator (59.8% in the 2nd quarter of 2017), and in
the 3rd quarter of 2017 it was equal to that registered in
Lithuania (63.6%), however lower than that recorded in Estonia (68.3%).
Data source: Eurostat
database, data on the 3rd quarter of 2017 – Labour Force
Surveys of Latvia, Lithuania and Estonia.
In the 3rd quarter
of 2017, the employment rate among young people (aged 15–24) constituted 35.0%,
which is 2.5 percentage points higher than in the corresponding period a
year before. The number of employed young people accounted for
62.1 thousand (60.9 thousand in the 3rd quarter of
2016).
In the 3rd quarter
of 2017, persons employed in the main job worked on average 38.8 hours per week
– 0.1 hours fewer than in the 3rd quarter of 2016.
The Labour Force Survey data
show that, compared to the 3rd quarter of 2016, in the 3rd quarter
of 2017 the share of employees receiving less than EUR 450.00 monthly
(after taxes) fell to 38.9% (a drop of 5.1 percentage points), while the
proportion of employees receiving minimum monthly wage or less constituted
149.3 thousand or 18.7% (reduction of 1.4 percentage points over the
year).The share of employees receiving EUR 450.01–700.00 monthly rose
by 1.9 percentage points (32.8% in the 3rd quarter of
2017) and that of employees receiving EUR 700.01–1400.00 monthly
increased by 3.1 percentage points (20.8% in the 3rd quarter
of 2017).In its turn, the proportion of employees receiving more than
EUR 1400 monthly grew by 0.2 percentage points (2.7% in the 3rdquarter
of 2017).Wage or salary of 2.9% of employees was not calculated or paid, while
1.9% did not indicate the size of earnings thereof.
Employees by monthly net wages and salaries in the main job (as %)
|
|
Q3 2016 |
Q2 2017 |
Q3 2017 |
|
Employees |
100.0 |
100.0 |
100.0 |
|
up to EUR
450.00 |
44.0 |
39.2 |
38.9 |
|
of which employees receiving minimum monthly wage or less |
20.1 |
18.9 |
18.7 |
|
EUR
450.01–700.00 |
30.9 |
31.8 |
32.8 |
|
EUR
700.01–1400.00 |
17.7 |
19.7 |
20.8 |
|
EUR
1400.01 and more |
2.5 |
3.7 |
2.7 |
|
was not calculated or paid |
3.5 |
3.4 |
2.9 |
|
not
specified |
1.4 |
2.2 |
1.9 |
Data source: Latvian Labour
Force Survey
In the 3rd quarter
of 2017, the Labour Force Survey covered 4.1 thousand households, in which 7.6
thousand persons aged 15–74 were interviewed.
More information on employment
statistics is available in the CSB database section Employment and Unemployment – Key Indicators. Results of the Labour Force Survey are published in the CSB database
section Employment and Unemployment.
As of the 3rd quarter
of 2017, the quarterly indicators on unemployed persons by main sector of
economic activity (NACE Rev.2) will not be published; only the annual
statistics will be published.


 «The Baltic Course» Is Sold and Stays in Business!
