
Analytics, Baltic Export, Foreign trade , Good for Business, Markets and Companies
International Internet Magazine. Baltic States news & analytics
Friday, 26.04.2024, 01:18
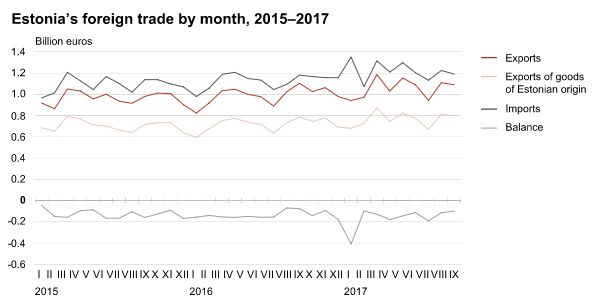
In Q3, exports in Estonia grew by 4% and imports by 6%
 Print version
In the 3rd quarter of 2017, exports of goods from
Estonia amounted to 3.1 billion euros and imports to Estonia to 3.5 billion
euros at current prices. The trade deficit was 390 million euros (in the 3rd
quarter of 2016, it was 302 million euros).
In the 3rd quarter of 2017, growth was fastest in the
exports of base metals and articles of base metal (up by 54 million euros),
wood and articles of wood (up by 41 million euros) and mineral products (up by
35 million euros). At the same time, there was considerable decline in the
exports of electrical equipment (down by 90 million euros). Growth in imports
was significantly affected by an increase in the imports of base metals and
articles of base metal (up by 57 million euros), mechanical appliances (up by
51 million euros) and transport equipment (up by 45 million euros).
The imports of electrical equipment decreased (down by
48 million euros). In the first nine months, the exports of goods increased by
8% and imports by 9% year on year.
In September 2017, the exports of goods decreased by
1% and imports increased by 1% compared to September 2016. In September 2017,
exports from Estonia amounted to 1.1 billion euros and imports to Estonia to
1.2 billion euros. The trade deficit was 99.5 million euros (in September
2016, it was 76.8 million euros).
The top destination countries of Estonia’s exports
were Finland (17% of Estonia’s total exports), Sweden (14%) and Latvia (9%).
The biggest decrease occurred in exports to the Netherlands (down by 30 million
euros) with less mineral products exported. The biggest increase occurred in
exports to Germany (up by 13 million euros) and Finland (up by 12 million
euros). In exports to Germany, the exports of electrical equipment increased,
and in exports to Finland, the exports of base metals and articles of base
metal, and mechanical appliances increased.
The biggest share in exports was held by electrical
equipment, followed by wood and articles of wood, and miscellaneous
manufactured articles. The greatest decrease was in the exports of electrical
equipment (down by 35 million euros) and mineral products (down by 19 million
euros). At the same time, the exports of base metals and articles of base metal
and of wood and articles of wood increased.
The share of goods of Estonian origin in total exports
was 73% in September. The exports of goods of Estonian origin increased 1% and
re-exports decreased 7%.
The main countries of consignment in September 2017
were Finland (13% of Estonia’s total imports), Germany (11%) and Lithuania
(10%). The biggest increase occurred in imports from Russia (up by 18 million
euros) and Latvia (up by 10 million euros). Imports from the United States and
Hungary decreased the most.
The main commodities imported to Estonia were
electrical equipment, transport equipment, agricultural products and food
preparations, mechanical appliances, and base metals and articles of base
metal. The biggest increase was in the imports of base metals and articles of
base metal, and mechanical appliances, and the biggest fall occurred in the
imports of electrical equipment.
|
Month |
Exports,
million euros |
Imports,
million euros |
Balance,
million euros |
|||||||||||
|
2016 |
2017 |
change, % |
2016 |
2017 |
change, % |
2016 |
2017 |
|||||||
|
January |
824.3 |
942.9 |
14 |
980.5 |
1 350.4 |
38 |
-156.3 |
-407.5 |
||||||
|
February |
920.1 |
972.8 |
6 |
1 060.1 |
1 072.1 |
1 |
-140.0 |
-99.3 |
||||||
|
March |
1 034.4 |
1 180.9 |
14 |
1 188.5 |
1 315.6 |
11 |
-154.2 |
-134.7 |
||||||
|
1st
quarter |
2 778.8 |
3 096.6 |
11 |
3 229.2 |
3 738.1 |
16 |
-450.4 |
-641.5 |
||||||
|
April |
1 048.4 |
1 029.3 |
-2 |
1 207.1 |
1 209.8 |
0 |
-158.7 |
-180.6 |
||||||
|
May |
999.7 |
1 150.7 |
15 |
1 149.4 |
1 297.8 |
13 |
-149.6 |
-147.0 |
||||||
|
June |
977.8 |
1 089.5 |
11 |
1 134.5 |
1 200.9 |
6 |
-156.7 |
-111.4 |
||||||
|
2nd
quarter |
3 025.9 |
3 269.5 |
8 |
3 490.9 |
3 708.5 |
6 |
-465.0 |
-439.0 |
||||||
|
July |
889.7 |
942.1 |
6 |
1 044.9 |
1 128.9 |
8 |
-155.2 |
-186.7 |
||||||
|
August |
1 024.0 |
1 111.9 |
9 |
1 093.7 |
1 215.8 |
11 |
-69.7 |
-103.9 |
||||||
|
September |
1 104.1 |
1 090.9 |
-1 |
1 180.9 |
1 190.4 |
1 |
-76.8 |
-99.5 |
||||||
|
3rd
quarter |
3 017.8 |
3 144.9 |
4 |
3 319.5 |
3 535.1 |
6 |
-301.6 |
-390.2 |
||||||
|
9 months |
8 822.5 |
9 511.0 |
8 |
10 039.6 |
10 981.7 |
9 |
-1 217.1 |
-1 470.7 |
||||||
|
Main foreign trade partners of Estonia, September 2017 |
||||||||||||||
|
Country of destination, group of countries |
Exports,
million euros |
Share, % |
Change on same month of previous year, % |
Country of consignment, group of countries |
Imports,
million euros |
Share, % |
Change on same month of previous year, % |
|||||||
|
TOTAL |
1 090.9 |
100 |
-1 |
TOTAL |
1 190.4 |
100 |
1 |
|||||||
|
EU-28 |
783.4 |
72 |
-2 |
EU-28 |
991.4 |
83 |
0 |
|||||||
|
Euro area
19 |
517.6 |
47 |
-2 |
Euro area
19 |
712.3 |
60 |
4 |
|||||||
|
Non-EU |
307.5 |
28 |
2 |
Non-EU |
199.0 |
17 |
3 |
|||||||
|
1. Finland |
183.0 |
17 |
7 |
1. Finland |
157.0 |
13 |
4 |
|||||||
|
2. Sweden |
158.0 |
14 |
-8 |
2. Germany |
131.7 |
11 |
5 |
|||||||
|
3. Latvia |
99.2 |
9 |
-9 |
3.
Lithuania |
121.6 |
10 |
6 |
|||||||
|
4. Germany |
79.5 |
7 |
19 |
4. Latvia |
109.5 |
9 |
10 |
|||||||
|
5. Russia |
77.8 |
7 |
6 |
5. Sweden |
104.5 |
9 |
-5 |
|||||||
|
6.
Lithuania |
62.4 |
6 |
-4 |
6. Poland |
88.3 |
7 |
4 |
|||||||
|
7. Norway |
47.7 |
4 |
0 |
7. Russia
s |
70.1 |
6 |
35 |
|||||||
|
8. Denmark |
29.5 |
3 |
-4 |
8.
Netherland |
66.5 |
6 |
-5 |
|||||||
|
9. United
Kingdom |
28.2 |
3 |
23 |
9. China |
50.8 |
4 |
15 |
|||||||
|
10. Poland |
25.8 |
2 |
22 |
10. United
Kingdom |
35.4 |
3 |
6 |
|||||||
|
Exports and imports by commodity section, September 2017 |
||||||||
|
Commodity section (chapter) by Combined Nomenclature (CN) |
Exports |
Imports |
Balance,
million euros |
|
||||
|
million
euros |
share, % |
change on same period of previous year, % |
million
euros |
share,% |
change on same period of previous year, % |
|
||
|
TOTAL |
1 090.9 |
100 |
-1 |
1 190.4 |
100 |
1 |
-99.5 |
|
|
Agricultural products and food preparations (I–IV) |
93.9 |
9 |
-4 |
124.5 |
10 |
2 |
-30.4 |
|
|
Mineral
products (V) |
89.4 |
8 |
-18 |
102.6 |
9 |
11 |
-13.1 |
|
|
Raw materials and products of chemical industry (VI) |
58.7 |
5 |
11 |
101.0 |
8 |
4 |
-42.2 |
|
|
Articles of plastics and rubber (VII) |
37.3 |
3 |
2 |
74.1 |
6 |
13 |
-36.7 |
|
|
Wood and articles of wood (IX) |
118.7 |
11 |
15 |
42.9 |
4 |
18 |
75.8 |
|
|
Paper and articles thereof (X) |
30.9 |
3 |
9 |
23.8 |
2 |
-7 |
7.1 |
|
|
Textiles and textile articles (XI) |
36.6 |
3 |
-4 |
61.1 |
5 |
2 |
-24.5 |
|
|
Base metals and articles of base metal (XV) |
98.1 |
9 |
29 |
115.3 |
10 |
16 |
-17.1 |
|
|
Mechanical
appliances (84) |
94.4 |
9 |
3 |
119.2 |
10 |
11 |
-24.8 |
|
|
Electrical
equipment (85) |
190.0 |
17 |
-15 |
184.4 |
16 |
-10 |
5.6 |
|
|
Transport
equipment (XVII) |
66.6 |
6 |
-4 |
126.8 |
11 |
-1 |
-60.2 |
|
|
Optical, measuring, precision instruments (XVIII) |
33.6 |
3 |
-4 |
27.7 |
2 |
-7 |
5.9 |
|
|
Miscellaneous
manufactured articles (XX) |
104.6 |
10 |
7 |
35.5 |
3 |
3 |
69.1 |
|
|
Other |
38.0 |
4 |
-14 |
51.8 |
4 |
-33 |
-13.8 |
|
The statistics are based on the questionnaires
“Intrastat” and “Exports (sale of fish and crustaceans in foreign waters and
ports)”, the due dates of which were, respectively, 14 and 15 October 2017, and
on the customs declaration data of the Estonian Tax and Customs Board, which
were sent to Statistics Estonia on 20 October 2017. Statistics Estonia
published the monthly summary of foreign trade in 13 working days. In the case
of the statistical activity “Foreign trade”, the main representative of public
interest is the Ministry of Economic Affairs and Communications, commissioned
by whom Statistics Estonia collects and analyses the data necessary for
conducting the statistical activity.


 «The Baltic Course» Is Sold and Stays in Business!
