
Analytics, Baltic Export, Foreign trade , Good for Business, Latvia, Markets and Companies
International Internet Magazine. Baltic States news & analytics
Thursday, 25.04.2024, 18:40
In July, foreign trade turnover in goods in Latvia rose by 14.4%
 Print version
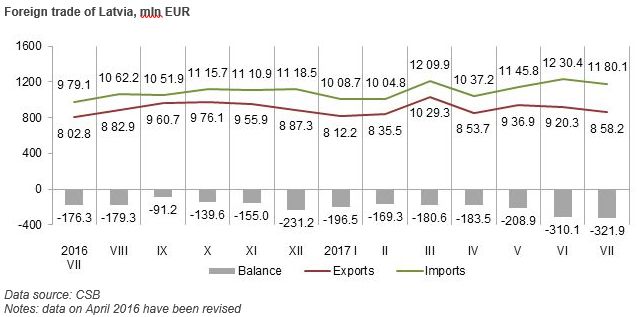
In June, Latvia exported goods
in the amount of EUR 858.2 mln, and imported goods in the amount of
EUR 1.18 bln. The foreign trade balance worsened, as exports in
the total foreign trade value fell to 42.1% (in July 2016 – 45.1%).
During the first seven months
of the present year, the foreign trade turnover of Latvia at current prices
reached EUR 14.06 bln – EUR 1.58 bln or 12.6% more than in the
corresponding period of 2016. The exports value constituted EUR 6.25 bln (an
increase of EUR 551.1 mln or 9.7%), whereas the imports value comprised
EUR 7.82 bln (an upturn of EUR 1.03 mln or 15.1%).
Calendar and seasonally
adjusted data show that, compared to July 2016, in July of the present year,
the exports value at current prices went up by 7.0% and the imports value by
19.9%, whereas compared to the month before, the exports value fell by 1.4% and
the imports value by 3.1%.
Main changes in exports in
July 2017, compared to July 2016:
-
exports of prepared foodstuffs up by EUR 34.0 mln or 60.1%;
- exports of base metals and articles of
base metals up by EUR 16.0 mln or 26.8%;
- exports of machinery and mechanical
appliances; electrical equipment up by EUR 15.4 mln or 10.7%;
- exports of live animals and animal
products up by EUR 9.9 mln or 30.3%;
- exports of vehicles, aircraft, vessels
and associated transport equipment down by EUR 39.9 mln or 46.6%.
Main changes in imports in
July 2017, compared to July 2016:
-
imports of machinery and mechanical appliances; electrical equipment up by EUR
43.1 mln or 20.5%;
- imports of prepared foodstuffs up by EUR
33.7 mln or 41.1%;
- imports of base metals and articles of
base metals up by EUR 30.4 mln or 43.1%;
- imports of mineral products up by EUR
18.1 mln or 20.4%;
- imports of vehicles, aircraft, vessels
and associated transport equipment down by EUR 23.0 mln or 22.0%.
In July, Lithuania (with 17.1%
of the total exports), Estonia (10.7%), Germany (7.8%) and Sweden (6.1%) were
the main export partners of Latvia in trade with the EU countries, and
Lithuania (with 18.0% of the total imports), Germany (11.2%), Poland (8.4%) and
Estonia (7.2%) were the main import partners.
Foreign trade of Latvia in
July 2017 by country group, at current prices
|
|
Exports |
Imports |
||||
|
|
Mln EUR |
% of total |
Changes as %, compared to July 2016 |
Mln EUR |
% of total |
Changes as %, compared to July 2016 |
|
Total |
858.2 |
100 |
6.9 |
1 180.1 |
100 |
20.5 |
|
European
Union countries |
610.2 |
71.1 |
6.8 |
902.5 |
76.5 |
13.8 |
|
Euro area countries |
411.6 |
48.0 |
7.5 |
674.0 |
57.1 |
17.5 |
|
CIS
countries |
125.3 |
14.6 |
32.4 |
126.3 |
10.7 |
33.6 |
|
Other
countries |
122.7 |
14.3 |
-10.3 |
151.3 |
12.8 |
65.3 |
Russia was the main partner in
trade with the third countries; in July, its share accounted for 10.5% in the
total Latvian exports and for 7.5% in the total Latvian imports.
Main commodities in exports of
Latvia in July 2017, at current prices
|
|
Thsd EUR |
% of total |
Changes as %,
compared to |
||
|
July 2016 |
June 2017 |
average of
previous 12 months |
|||
|
Total |
858 213 |
100 |
6.9 |
-6.7 |
-5.1 |
|
wood and wood products; wood charcoal |
142 962 |
16.7 |
5.7 |
-11.2 |
-5.6 |
|
electrical
machinery and equipment |
103 685 |
12.1 |
10.9 |
-7.7 |
-0.8 |
|
machinery
and mechanical appliances |
56 623 |
6.6 |
10.2 |
-3.5 |
4.4 |
|
beverages,
spirits and vinegar |
48 465 |
5.6 |
96.1 |
13.8 |
26.4 |
|
vehicles other than railway or tramway rolling stock, and parts and
accessories thereof |
42 156 |
4.9 |
-3.6 |
-10.1 |
-15.5 |
|
pharmaceutical
products |
37 142 |
4.3 |
12.5 |
-7.7 |
6.9 |
|
mineral fuels, mineral oils and products of their distillation |
36 585 |
4.3 |
-13.9 |
-8.0 |
-7.3 |
|
iron and
steel |
31 696 |
3.7 |
90.8 |
-27.6 |
3.6 |
|
articles of iron or steel |
27 707 |
3.2 |
1.0 |
-21.8 |
-5.5 |
|
furniture, other furnishing articles; prefabricated buildings |
26 697 |
3.1 |
20.8 |
-9.0 |
0.4 |
Rise in exports of alcoholic
and non-alcoholic beverages in July 2017, compared to July 2016, was
facilitated by the increase in exports of spirits by EUR 19.9 mln or
2.3 times. In its turn, exports of mineral fuels, mineral oils and products
of their distillation reduced, as exports of diesel oil dropped by EUR
9.7 mln or 45.2%.
Main commodities in imports of
Latvia in July 2017, at current prices
|
|
Thsd EUR |
% of total |
Changes as %,
compared to |
||
|
July 2016 |
June 2017 |
average of
previous 12 months |
|||
|
Total |
1 180 142 |
100 |
20.5 |
-4.1 |
8.3 |
|
electrical
machinery and equipment |
128 305 |
10.9 |
15.8 |
-4.5 |
2.2 |
|
machinery
and mechanical appliances |
124 603 |
10.6 |
25.8 |
14.0 |
23.4 |
|
mineral fuels, mineral oils and products of their distillation |
101 464 |
8.6 |
20.2 |
-5.1 |
5.0 |
|
vehicles other than railway or tramway rolling stock, and parts and
accessories thereof |
79 022 |
6.7 |
-17.1 |
-18.6 |
-16.4 |
|
beverages,
spirits and vinegar |
56 190 |
4.8 |
2.1 times |
9.7 |
59.2 |
|
plastics
and articles thereof |
54 317 |
4.6 |
29.5 |
3.6 |
19.2 |
|
iron and
steel |
48 494 |
4.1 |
78.8 |
-11.1 |
21.9 |
|
pharmaceutical
products |
40 347 |
3.4 |
-7.5 |
-33.3 |
-17.2 |
|
wood and wood products; wood charcoal |
37 103 |
3.1 |
21.9 |
-0.3 |
3.8 |
|
articles of iron or steel |
28 205 |
2.4 |
26.8 |
-2.3 |
16.5 |
Growth in the imports of
beverages, spirits and vinegar in July 2017, compared to July 2016, was
facilitated by the increase in imports of spirits by EUR 17.5 mln or
2.6 times. Meanwhile, decline in the imports of vehicles other than railway
or tramway rolling stock, and parts and accessories thereof was mainly
influenced by the reduction in imports of passenger cars of EUR 14.2 mln or
34.0%.
More information on foreign
trade of Latvia in breakdown by month and quarter, as well as by country group
and commodity group is available in the CSB database section Foreign Trade.


 «The Baltic Course» Is Sold and Stays in Business!
