
Analytics, Good for Business, Latvia, Markets and Companies, Retail
International Internet Magazine. Baltic States news & analytics
Thursday, 25.04.2024, 19:19
In April, retail trade turnover in Latvia grew by 1.8% y-o-y
 Print version
Compared to April 2015, in April 2016 the most significant turnover growth was recorded in retail sale of information and communication equipment (of 19.2%), in retail sale of food, beverages and tobacco in specialised stores (of 8.7%), in retail sale of clothing, footwear and leather goods (of 7.5%), in retail sale of pharmaceutical and medical goods (of 7.0%), in retail sale of sporting equipment, games and toys (of 5.7%), in retail sale via mail order houses or via Internet (of 4.9%). Retail sale of automotive fuel remained at the level of the previous month (growth of 0.5%). In turn, drop was recorded in retail sale of hardware, paints and glass (of 4.8%), retail sale of books and stationery (of 4.4%). Retail trade in stalls and markets keeps decreasing - a drop of 4.9% in April 2016, as compared to April 2015.
Total retail trade turnover at current prices rose by 1.4% (not taking into account the calendar influence).
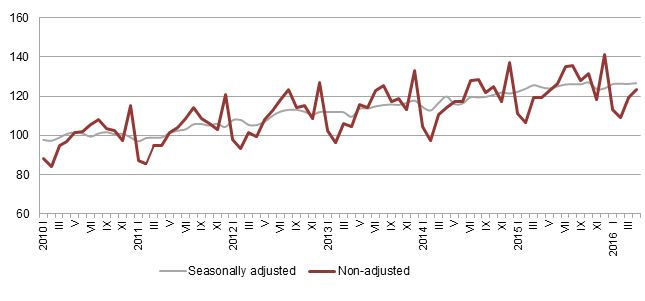 |
| Retail trade turnover indices (as % over average monthly turnover of 2010, at constant prices) |
Compared to March 2016, the total retail trade turnover in April 2016 grew by 0.3% (according to seasonally adjusted data at constant prices). Retail trade in food products decreased by 0.3%, and turnover of non-food products went down by 1.1%.
Compared to March, growth was recorded in retail sale of automotive fuel (of 5.4%), in retail sale of flowers, plants, seeds, fertilisers (of 6.5%), in retail sale of cultural and recreation goods (of 5.3%), in retail sale of cosmetics and toiletries (of 5.3%), as well as in retail sale of information and communication equipment (of 3.1%). In turn, drop was observed in retail sale via mail order houses or via Internet (of 9.1%), and in retail sale of clothing, footwear and leather goods (of 2.8%).
Compared to March, the total retail trade turnover at current prices, not taking into account seasonality, in April rose by 1.4%. The same turnover growth (of 1.4%) was also recorded a year before - in 2015.
Turnover indices of retail trade enterprises by main kind of economic activity (at constant prices)
|
|
January–April 2016 as% of January–April 2015 (calendar adjusted) |
April 2016,% compared to |
|||
|
March 2016 (seasonally adjusted) |
April 2015 (calendar adjusted) |
||||
|
Retail trade - total |
101.8 |
100.3 |
101.8 |
||
|
|
retail sale of food products, total |
101.3 |
99.7 |
99.6 |
|
|
|
retail sale of non-food products, total |
102.2 |
101.1 |
103.0 |
|
|
|
|
retail trade in non-specialised stores selling mainly non-food products |
97.3 |
102.3 |
99.2 |
|
|
|
retail sale of information and communication equipment in specialised stores |
119.1 |
103.1 |
119.2 |
|
|
|
retail sale of hardware, paints and glass |
99.1 |
100.3 |
95.2 |
|
|
|
retail sale of cultural and recreation goods |
102.9 |
105.3 |
102.9 |
|
|
|
retail sale of clothing, footwear and leather goods |
111.1 |
97.2 |
107.5 |
|
|
|
retail sale of pharmaceutical and medical goods |
108.1 |
100.6 |
107.0 |
|
|
|
retail sale of automotive fuel |
94.7 |
105.4 |
100.5 |
More information on seasonally adjusted, calendar adjusted and non-adjusted retail trade turnover indices is available in the CSB database section Trade and Services.


 «The Baltic Course» Is Sold and Stays in Business!
