
Analytics, Baltic Export, Baltic States – CIS, EU – Baltic States, Foreign trade , Good for Business, Latvia
International Internet Magazine. Baltic States news & analytics
Wednesday, 24.04.2024, 07:03
In March, exports value grew by 7.1% in Latvia
 Print version
In March, Latvia exported goods in the amount of EUR 833.8 mln, and imported – in the amount of EUR 1 025.8 mln. As exports in total foreign trade value declined to 44.8% (in February 2016 – 45.9%), foreign trade balance slightly worsened.
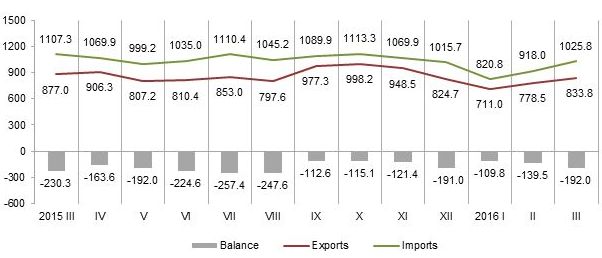 |
| Latvia’s foreign trade, mln EUR |
Note: data on January, February, March and December 2015 have been revised
Main changes in exports in March, compared to February:
- exports of products of the chemical and allied industries grew by EUR 22.1 mln or 38.1%,
- exports of mineral products increased by EUR 8.9 mln or 25.2%,
- exports of prepared foodstuffs rose by EUR 6.8 mln or 11.7%,
- exports of articles of stone, plaster, cement, glassware and ceramic products grew by EUR 6.4 mln or 32.6%,
- exports of machinery and mechanical appliances; electrical equipment decreased by EUR 2.2 mln or 1.7%,
Main changes in imports in March, compared to February:
- imports of products of the chemical and allied industries grew by EUR 21.9 mln or 18.7%,
- imports of mineral products rose by EUR 17.9 mln or 25.2%,
- imports of machinery and mechanical appliances; electrical equipment grew by EUR 10.5 mln or 5.5%,
- imports of vegetable products increased by EUR 10.4 mln or 22.9%,
- imports of prepared foodstuffs rose by EUR 10.4 mln or 13.4%,
- imports of textiles and textile articles decreased by EUR 1.7 mln or 3.8%,
In March, Lithuania (with 16.4% of total exports), Estonia (12.6%), Germany (6.8%) and Poland (6.3%) were the main export partners in trade with the EU countries; in turn, Lithuania (with 16.3% of total imports), Poland (11.4%), Germany (10.0%) and Estonia (8.4%) were the main import partners of Latvia.
Foreign trade of Latvia by country group in March 2016, at current prices
|
|
Exports |
Imports |
||||
|
|
EUR mln |
% of total |
Changes as% over February 2016 |
mln EUR |
% of total |
Changes as% over February 2016 |
|
Total |
833.8 |
100 |
7.1 |
1 025.8 |
100 |
11.7 |
|
Member States of the European Union |
611.3 |
73.3 |
6.8 |
806.4 |
78.6 |
11.2 |
|
Euro area countries |
400.6 |
48.0 |
3.0 |
569.4 |
55.5 |
8.8 |
|
CIS countries |
87.3 |
10.5 |
19.2 |
112.4 |
11.0 |
6.9 |
|
Other countries |
135.2 |
16.2 |
1.9 |
107.0 |
10.4 |
22.2 |
Russia was the main partner in trade with third countries; its share in total Latvian exports in March accounted for 6.3%, and in imports – for 8.1%.
Changes of main commodities in Latvia’s exports in March 2016, at current prices
|
|
thsd EUR |
% of total |
Changes as% over |
||
|
March 2015 |
February 2016 |
average of previous 12 months |
|||
|
Total |
833 835 |
100 |
-4.9 |
7.1 |
-2.8 |
|
wood and wood products; wood charcoal |
164 001 |
19.7 |
1.4 |
0.5 |
11.3 |
|
electrical machinery and equipment |
72 182 |
8.7 |
-35.9 |
-9.8 |
-29.0 |
|
machinery and mechanical appliances |
54 112 |
6.5 |
10.2 |
11.6 |
5.4 |
|
mineral fuels, mineral oils and products of their distillation |
40 576 |
4.9 |
-29.4 |
26.9 |
-21.9 |
|
pharmaceutical products |
39 458 |
4.7 |
28.6 |
26.7 |
40.7 |
|
vehicles other than railway or tramway |
33 419 |
4.0 |
-20.8 |
11.5 |
-16.9 |
|
iron and steel |
31 371 |
3.8 |
24.6 |
5.3 |
3.5 |
|
cereals |
30 783 |
3.7 |
65.0 |
1.5 |
-13.8 |
|
articles of iron and steel |
28 140 |
3.4 |
4.6 |
3.7 |
1.6 |
|
beverages, spirits and vinegar |
25 702 |
3.1 |
14.6 |
13.8 |
-20.8 |
The rise in exports of cereals in March 2016 (as compared to March 2015) was affected by growth in exports of wheat and wheat and rye mix of EUR 10.1 mln or 57.4%. In turn, drop in exports of mobile telephones of EUR 36.0 mln or 80.1% influenced the decrease in imports of electrical machinery and equipment.
Changes of main commodities in Latvia’s imports in March 2016, at current prices
|
|
thsd EUR |
% of total |
Changes as % over |
||
|
March 2015 |
February 2016 |
average of previous 12 months |
|||
|
Total |
1 025 829 |
100 |
-7.4 |
11.7 |
-0.7 |
|
machinery and mechanical appliances |
103 673 |
10.1 |
2.9 |
15.9 |
1.8 |
|
electrical machinery and equipment |
96 106 |
9.4 |
-25.2 |
-3.7 |
-21.0 |
|
mineral fuels, mineral oils and products of their distillation |
85 841 |
8.4 |
-30.9 |
28.4 |
-26.0 |
|
vehicles other than railway |
76 071 |
7.4 |
-7.5 |
4.6 |
-4.2 |
|
pharmaceutical products |
51 388 |
5.0 |
2.2 |
-10.2 |
14.5 |
|
plastics and articles thereof |
40 793 |
4.0 |
-10.4 |
13.0 |
-2.1 |
|
wood and wood products; wood charcoal |
40 475 |
3.9 |
20.0 |
21.6 |
32.1 |
|
miscellaneous chemical products |
32 143 |
3.1 |
25.1 |
2.6 times |
2.4 times |
|
iron and steel |
27 849 |
2.7 |
-12.0 |
31.9 |
-17.4 |
|
beverages, spirits and vinegar |
26 342 |
2.6 |
2.3 |
2.2 |
-7.6 |
Rise in imports of wood, wood products and wood charcoal in March 2016, as compared to March 2015, was affected by the increase in imports of sawn wood of EUR 2.2 mln or 26.9%. In turn, drop in imports of mineral fuels, mineral oils and products of their distillation was mostly influenced by decrease in imports of diesel oil of EUR 30.8 mln or 47.9%.
More information on foreign trade of Latvia by month and quarter, by country group and commodity group is available in the CSB data base section Foreign Trade.


 «The Baltic Course» Is Sold and Stays in Business!
