
Analytics, Baltic Export, Foreign trade , Good for Business, Latvia
International Internet Magazine. Baltic States news & analytics
Tuesday, 16.04.2024, 17:36
In February, foreign trade turnover in Latvia grew by 10.8%
 Print version
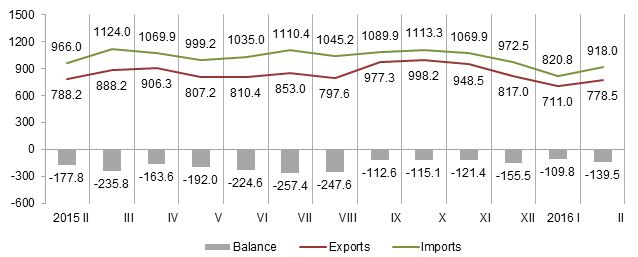
In February, Latvia exported goods in the amount of EUR 778.5 mln, and imported – in the amount of EUR 918.0 mln. As exports in total foreign trade value declined to 45.9% (in January 2016 – 46.4%), foreign trade balance slightly worsened.
 |
| Latvia’s foreign trade, mln EUR |
Data
source: CSB, ATD200.
EXPORTS AND IMPORTS BY COUNTRY IN 2000-2015 (CN at 2-digit level, euros)
Notes: data on November 2015 have been revised
Main changes in exports in February, compared to January:
· exports of wood and articles of wood grew by EUR 26.6 mln or 19.4%,
· exports of machinery and mechanical appliances; electrical equipment rose by EUR 18.9 mln or 17.3%,
· exports of basic metals and articles of basic metals grew by EUR 16.2 mln or 29.6%,
· exports of prepared foodstuffs rose by EUR 7.9 mln or 15.7%,
· exports of vegetable products dropped by EUR 7.6 mln or 11.9%.
Main changes in imports in February, compared to January:
· imports of products of the chemical and allied industries grew by EUR 23.5 mln or 25.0%,
· imports of machinery and mechanical appliances; electrical equipment rose by EUR 21.6 mln or 12.9%,
· imports of vehicles and associated transport equipment increased by EUR 19.5 mln or 35.2%,
· imports of prepared foodstuffs rose by EUR 11.5 mln or 17.5%,
· imports of mineral products dropped by EUR 44.6 mln or 38.5%.
In February main export partners in trade with the EU countries were Lithuania (16.4% of total export), Estonia (12.6%), Germany (7.4%) and the United Kingdom (5.7%); main import partners were Lithuania (16.6% of total imports), Germany (12.1%), Poland (11.3%) and Estonia (7.9%).
Foreign trade of Latvia in February 2016 by country group, at current prices
|
|
Exports |
Imports |
||||
|
|
mln EUR |
% of total |
Changes as% over January |
mln EUR |
% of total |
Changes as% over January |
|
Total |
778.5 |
100 |
9.5 |
918.0 |
100 |
11.8 |
|
Member States of the European Union |
572.6 |
73.6 |
8.1 |
725.2 |
79.0 |
16.8 |
|
Euro area countries |
389.0 |
50.0 |
10.2 |
523.2 |
57.0 |
16.0 |
|
CIS countries |
73.3 |
9.4 |
29.7 |
105.2 |
11.5 |
-14.3 |
|
Other countries |
132.6 |
17.0 |
6.5 |
87.6 |
9.5 |
13.9 |
The main partner in trade with third countries was Russia, the share of which in total Latvian exports in February accounted for 6.0%; in imports – for 8.3%.
Changes of main commodities in Latvia’s exports in February 2016, at current prices
|
|
thsd EUR |
% of total |
Changes as% over |
||
|
February 2015 |
January 2016 |
average of previous 12 months |
|||
|
Total |
778 499 |
100 |
-1.2 |
9.5 |
-9.3 |
|
wood and wood products; wood charcoal |
163 195 |
21.0 |
20.8 |
19.5 |
12.3 |
|
electrical machinery and equipment |
79 993 |
10.3 |
-37.5 |
7.5 |
-24.1 |
|
machinery and mechanical appliances |
48 509 |
6.2 |
0.4 |
38.0 |
-5.5 |
|
mineral fuels, mineral oils and products of their distillation |
31 976 |
4.1 |
-44.7 |
-14.9 |
-41.2 |
|
pharmaceutical products |
31 138 |
4.0 |
13.5 |
13.6 |
12.5 |
|
cereals |
30 324 |
3.9 |
2.1 times |
-30.2 |
-11.9 |
|
vehicles other than railway or tramway |
29 969 |
3.8 |
-12.9 |
0.1 |
-25.8 |
|
iron and steel |
29 785 |
3.8 |
63.9 |
61.2 |
2.0 |
|
articles of iron and steel |
27 133 |
3.5 |
12.1 |
12.7 |
-1.7 |
|
beverages, spirits and vinegar |
22 576 |
2.9 |
-0.8 |
35.6 |
-30.5 |
The rise in exports of cereals in February 2016 (as compared to February 2015) was affected by growth of EUR 19.2 mln or 3.2 times in exports of wheat and wheat and rye mix. In turn, exports of products of distillation of mineral oils witnessed decrease, as exports of diesel oil decreased by EUR 27.1 mln or 74.1%.
Changes of main commodities in Latvia’s imports in February 2016, at current prices
|
|
thsd EUR |
% of total |
Changes as % over |
||
|
February 2015 |
January 2016 |
average of previous 12 months |
|||
|
Total |
917 971 |
100 |
-5.0 |
11.8 |
-11.3 |
|
electrical machinery and equipment |
99 845 |
10.9 |
-18.8 |
-5.0 |
-19.3 |
|
machinery and mechanical appliances |
89 446 |
9.7 |
8.7 |
42.7 |
-11.1 |
|
vehicles other than railway or tramway rolling stock, and parts and accessories thereof |
72 704 |
7.9 |
7.2 |
35.5 |
-6.7 |
|
mineral fuels, mineral oils and products of their distillation |
66 851 |
7.3 |
-30.3 |
-40.0 |
-43.5 |
|
pharmaceutical products |
57 219 |
6.2 |
35.6 |
32.7 |
30.3 |
|
plastics and articles thereof |
36 104 |
3.9 |
-9.2 |
16.7 |
-14.2 |
|
wood and wood products; wood charcoal |
33 296 |
3.6 |
11.0 |
25.6 |
8.8 |
|
beverages, spirits and vinegar |
25 783 |
2.8 |
21.7 |
42.0 |
-7.5 |
|
paper and paperboard; articles thereof |
22 640 |
2.5 |
-1.6 |
18.0 |
2.6 |
|
iron and steel |
21 110 |
2.3 |
-58.7 |
-28.0 |
-41.8 |
Growth of imports of pharmaceutical products in February 2016, as compared to February 2015, was mostly affected by increase in imports of medicines of EUR 7.6 mln or 23.4%. In turn, decline in imports of iron and non-alloy steel of EUR 29.0 mln or of 67.5% had the most significant effect on imports of iron and steel.
More information on foreign trade of Latvia by month and quarter, by country group and commodity group is available in the CSB data base section Foreign Trade.


 «The Baltic Course» Is Sold and Stays in Business!
